Training Data: The Sim-to-Real Gap Is Not the One You've Been Quoted
Why read: the benchmark comparison the industry has repeated for six months does not mean what it is quoted to mean.
By Embodied AI Frontier
Three robot training data routes published benchmark results within seven weeks of each other in late 2026. Figure reported 56% full-task success across 30 homes it had never visited, using a system pretrained on crowdsourced human video. Apple reported 91% average single-skill success in six unmapped homes, using data generated entirely in simulation. The winner of the 2026 BEHAVIOR Challenge reported 48.2% full-task success, using real teleoperation data inside a simulator. All three results circulate under the same label, zero-shot, though they measure three task families, three data sources and two scoring rules.
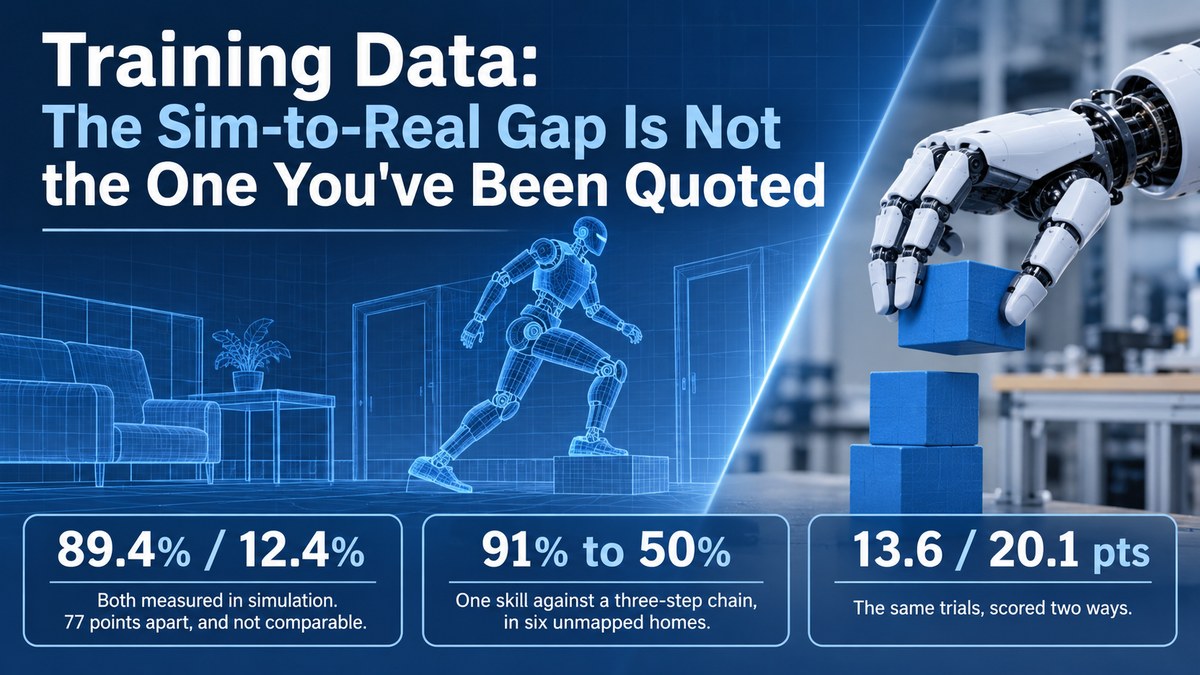
The comparison the industry has repeated since April 2026, 89.4% success in software simulation against 12% in household tasks, traces back to two simulation benchmarks rather than to a simulation-versus-reality contrast. The two share neither a task set nor a success rule, so the difference between them cannot be subtracted. Within a single edition of the same event, switching between partial credit and all-or-nothing scoring moves the reading by 14 to 20 points.
The physical source of the remaining difference lies at contact. Simulation data now trains a robot to move its body through an unfamiliar room. The dynamics that follow the moment a hand touches a surface still require real interaction to observe.
Five things are worth watching over the next two years: whether evaluation splits into more than one headline metric, whether real-robot data is priced by calibration rather than by hour, whether generative simulation crosses the physical-consistency threshold, whether open repositories reach a reproducible grade, and whether tactile and failure data become scoring categories in their own right.
Article structure
- 1. Three Public Scorecards on Three Different Tasks
- 2. Where the Two Numbers Came From
- 3. The Constraint Sits at Contact
- 4. Five Trends Taking Shape in 2026
- 5. China's Two Data Infrastructure Routes
- 6. Where the Split Falls, and What to Watch
1. Three Public Scorecards on Three Different Tasks
1.1 Three routes, three task sets
On September 17, 2026, Figure published results for Helix 2.5. Across 30 rental homes in the San Francisco Bay Area where the company had collected no data, the robot made beds, folded towels and tidied toys. It completed 237 of 420 full tasks, a success rate of 56%. The same release carries a control arm. With demonstration data, model architecture, training parameters and evaluation held constant, removing pretraining on Figure's own video index drops success to 9%17"Helix 2.5: Zero-Shot 30-Home Generalization"View the entry below →. Both numbers come from one evaluation pipeline, which means a large share of the 56% rests on knowledge acquired before the task demonstrations arrived.
Seven weeks later, on November 4, Apple's research team posted *Perceptive Humanoid Motion from Simulation* to arXiv and disclosed HALO, a whole-body control system for humanoids. The study ran a Unitree G1 through six locomotion and navigation skills in six real homes that had not been scanned or mapped in advance, repeating each skill ten times per home for 360 trials. Average single-skill success was 91%. Every model ran on the robot: a Mac mini on its back, with no network connected by default1Perceptive Humanoid Motion from SimulationView the entry below →6"Apple discloses HALO humanoid system, validated on Unitree G1 with Qwen models"View the entry below →.
The third result comes from a competition. The second BEHAVIOR Challenge, a Stanford-run benchmark of long-horizon household tasks in simulated homes, closed in early November after expanding from 50 tasks to 100, from three scenes to seven, and from 96 entrants to 265. Submissions rose from 18 to 57. The winning team reached 48.2% full-task success, against 12.4% for the same metric at the 2025 edition11Official leaderboardView the entry below →12*One Policy for 100 Household TasksView the entry below →.
The two BEHAVIOR numbers cannot be subtracted from each other. Task count doubled, scene count more than doubled, the per-episode time limit tightened from twice the human average to one and a half times, and the track structure moved from two tracks to one. A control published by one entrant, Robot Learning Collective, puts its own Q-score on last year's 50 tasks at 0.260 in 2025 and 0.371 in 2026, with the limit shortened by a quarter11Official leaderboardView the entry below →12*One Policy for 100 Household TasksView the entry below →. The gain therefore does not reduce to an easier task set.
Table 1: Three data routes, their training data and reported results (published Sep 17 and Nov 4, 2026)
| Route | Training data and tasks | Reported result |
|---|---|---|
| Figure Helix 2.5 | Crowd video pretraining plus few demos; bed making, towel folding, toy tidying | 56% zero-shot in 30 homes (237/420); 9% without pretraining |
| Apple HALO | 1,000 generated homes, 300 hours, simulation only; six motion skills | 91% single-skill in six homes; 70% chained; 50% hardest chain |
| BEHAVIOR 2026 | 200 demo episodes per task, 1,950 hours; 100 long-horizon chores | 48.2% for the winner; 12.4% for the same metric in 2025 |
Source: Figure (Sep 17, 2026); arXiv:2611.06908; BEHAVIOR Challenge leaderboard (Nov 4, 2026)
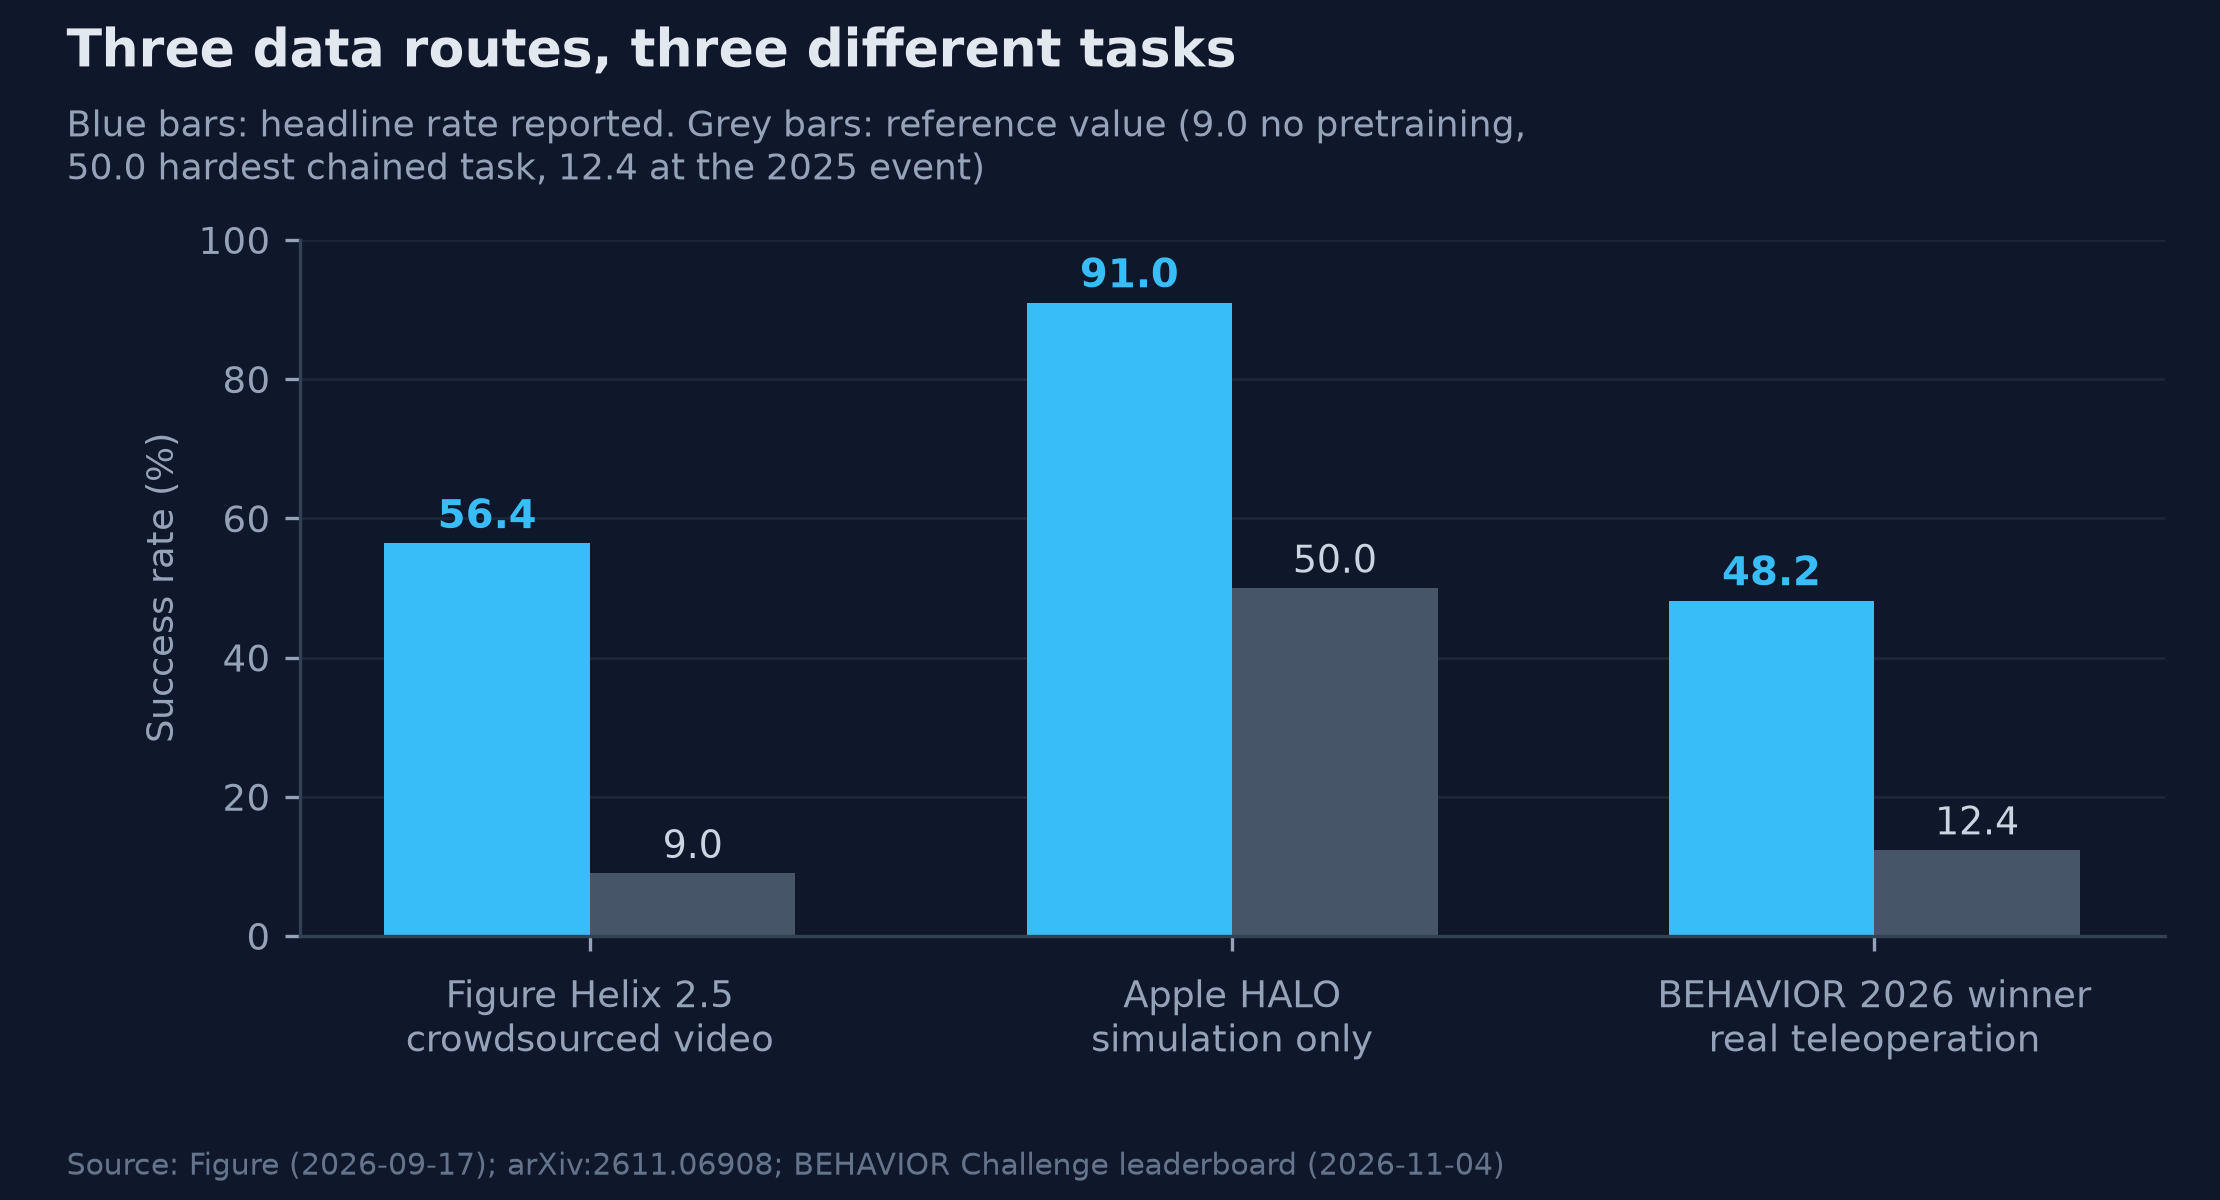
Fig 1 Three data routes and the tasks each was evaluated on
Source: Figure (Sep 17, 2026); arXiv:2611.06908; BEHAVIOR Challenge leaderboard (Nov 4, 2026)
1.2 Why the chained number is lower
No direct comparison is available between these scorecards, and the reason lies in task structure rather than in the numbers. Apple's per-skill results cluster tightly. Crouching under a table succeeded in 100% of trials, sidestepping through a half-open door in 93%, walking to a designated object in 92% and sitting on a chair in 85%1Perceptive Humanoid Motion from SimulationView the entry below →5"Apple's HALO Teaches a Unitree G1 to Navigate Unseen Rooms With Simulation-Generated Data"View the entry below →. Each of these actions involves a brief contact, a single object and a failure cost near zero, which is not the same problem as a continuous industrial sequence where contact must be maintained throughout1Perceptive Humanoid Motion from SimulationView the entry below →.
Performance falls once the same system runs a longer sequence. The composite evaluation took place in one real home, with three action combinations repeated ten times each. Average success was 70%. The hardest group, which combined ducking under an obstacle, walking to the target and pushing a box away, succeeded five times in ten. The paper attributes the shortfall to state drift: posture or position at the end of one step leaves the robot badly placed for the next, and the system has no built-in routine for detecting the deviation and retrying2HALO project pageView the entry below →.
BEHAVIOR tasks fall on the far side of that line. A demonstration averages 5.9 minutes, the evaluation allows one and a half times the human duration, and an interrupted task earns no second attempt. The 48.2% therefore describes the probability of finishing a complete household chore without help12*One Policy for 100 Household TasksView the entry below →. Set against the 91% single-skill figure, the gap reflects task structure. A single skill measures whether an action can be executed accurately. A long task measures whether a sequence still converges once errors accumulate. The two improve along different paths: the first through motion precision, the second only through failure recovery and state estimation.
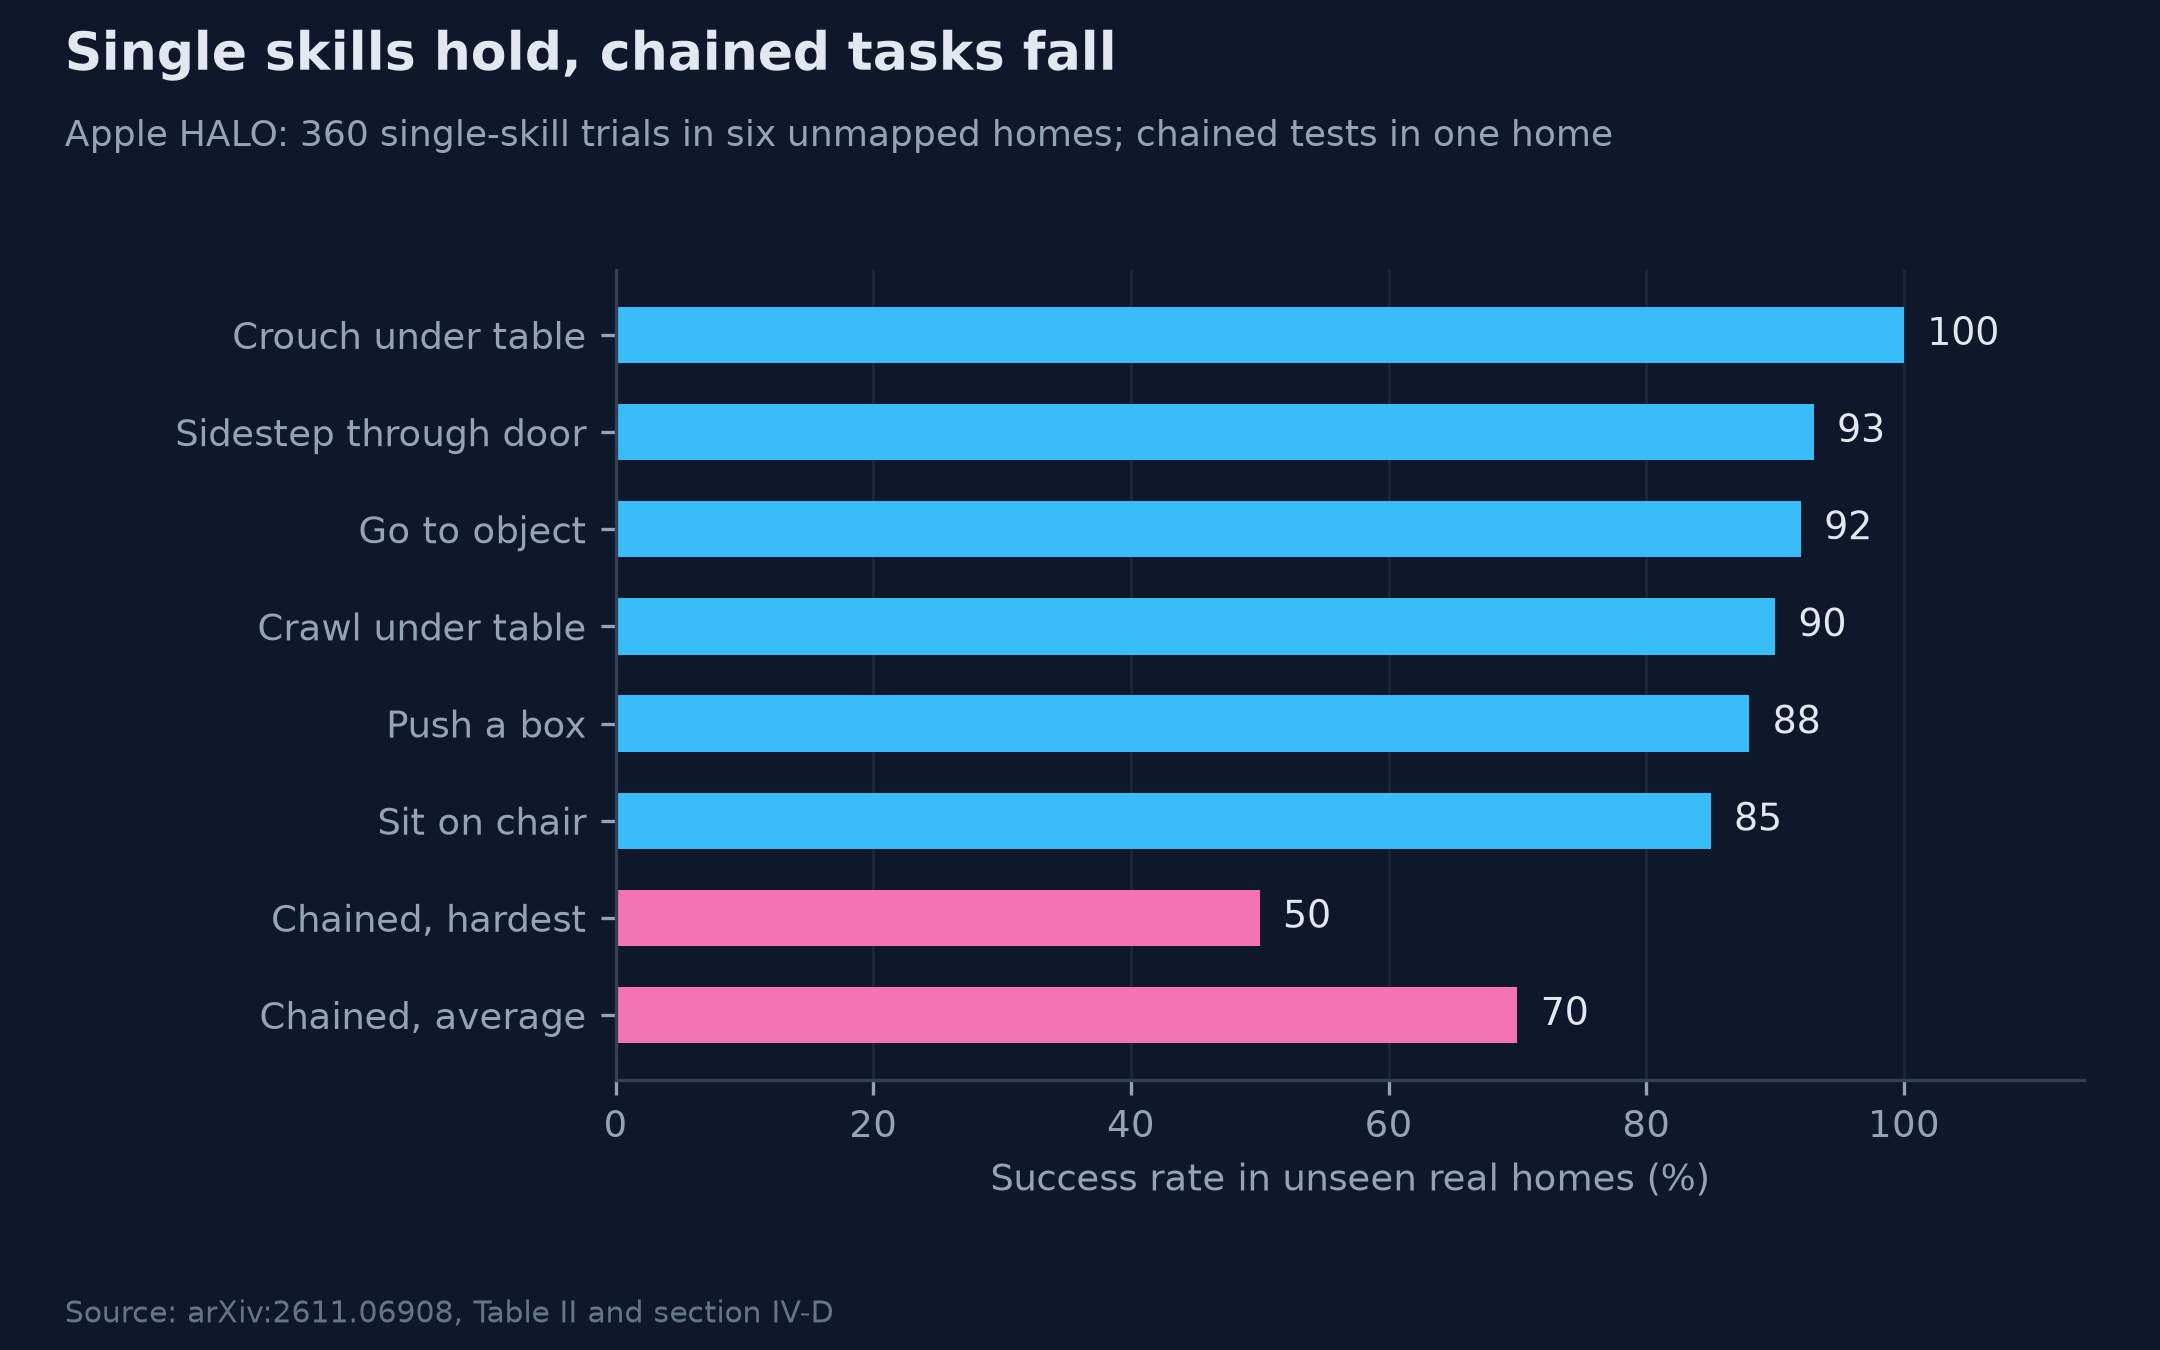
Fig 2 Apple HALO, single skills against chained tasks
Source: arXiv:2611.06908, Table II and Section IV-D
2. Where the Two Numbers Came From
2.1 What the two numbers actually measure
In April 2026, Stanford HAI published the *AI Index Report 2026*. Pages 116 and 117 of the technical performance chapter carry two figures that circulated for the following six months: robotic manipulation reaching 89.4% success in software-based simulation, and robots fully succeeding at only 12% of household tasks8AI Index Report 2026, technical performance chapterView the entry below →9AI Index Report 2026, full report PDFView the entry below →.
The two come from different evaluation systems. The 89.4% belongs to RLBench, a manipulation benchmark of 18 short tasks with 100 human demonstrations each, and to a method named EquAct, which reports an average across those 18 tasks. The same page states that these benchmarks test relatively short tasks in controlled simulation, and names the previous leading method, SAM2Act, at 86.8%8AI Index Report 2026, technical performance chapterView the entry below →.
The 12% is 12.4% rounded. It belongs to BEHAVIOR-1K, a benchmark of 1,000 household activities built around long-horizon mobile manipulation. Page 116 describes it as "a simulation benchmark" and page 117 adds that it tests "long-horizon mobile manipulation challenges in simulated home environments". The 12.4% is the 2025 winner's full-task success on the held-out test set, where the same entry scored 0.26 on Q-score8AI Index Report 2026, technical performance chapterView the entry below →9AI Index Report 2026, full report PDFView the entry below →11Official leaderboardView the entry below →.
Both figures were measured inside simulators, and they differ in task length, task count and completion rule. The 77 points that appear when the two are placed side by side measure the difficulty gap between short tasks and long household chores. They do not form a simulation-versus-reality contrast.
2.2 How the qualifiers disappeared
The two figures appear in separate subsections of the report and never share a paragraph in its body. What brought them into one sentence was the summary layer. Page 9, Top Takeaways item 5, reads: "Robots succeed in only 12% of household tasks... On RLBench, robotic manipulation in software-based simulations has reached 89.4% success." Page 72, Chapter Highlights item 10, rewrites the same sentence as "12% of real household tasks"8AI Index Report 2026, technical performance chapterView the entry below →9AI Index Report 2026, full report PDFView the entry below →.
Both pages drop the simulation qualifier, and the second introduces the word real. Two observations follow. The 423-page report contains the term sim-to-real zero times, so the institution never named this pair a transfer gap. Downstream, Forbes wrote on April 14, 2026 that robots "fully succeed safely at only about 12% of real household tasks"15"Humanoid Robots' 88% Fail Rate: Completing Home Tasks"View the entry below →, and The Next Web completed the contrast in a single sentence: "Robotic manipulation systems achieve 89.4% success in simulation but only 12% in real household tasks"16"Stanford's AI Index finds China has nearly closed the performance gap"View the entry below →.
Downstream citation keeps the numbers and discards the conditions. Once the wording compresses to that level, both benchmark names and both source conditions fall away, leaving a figure that fits any context.
2.3 How much the scoring rule moves the reading
Even with the technology and the trials held fixed, the choice of metric changes the reading. BEHAVIOR ranks entries by Q-score, a partial-credit measure of how many goal conditions were satisfied. The convention in the literature is full-task success, counted all or nothing. The 2025 winner scored 0.26 and 12.4%. The 2026 winner scored 0.683 and 48.2%. Each pair describes the same team on the same trials11Official leaderboardView the entry below →12*One Policy for 100 Household TasksView the entry below →.
Changing the arithmetic on one batch of trials moves the reading by 13.6 and 20.1 points. Popular citation never carries this layer, though investment decisions turn on it. The 77-point figure argues that simulation cannot be relied on and that real-world collection must scale. Once it is clear that the 77 came from subtracting one benchmark from another, that inference loses its starting point. There is no difference to compute between 89.4% and 12.4%, because the task sets differ and the rules for counting success differ as well.
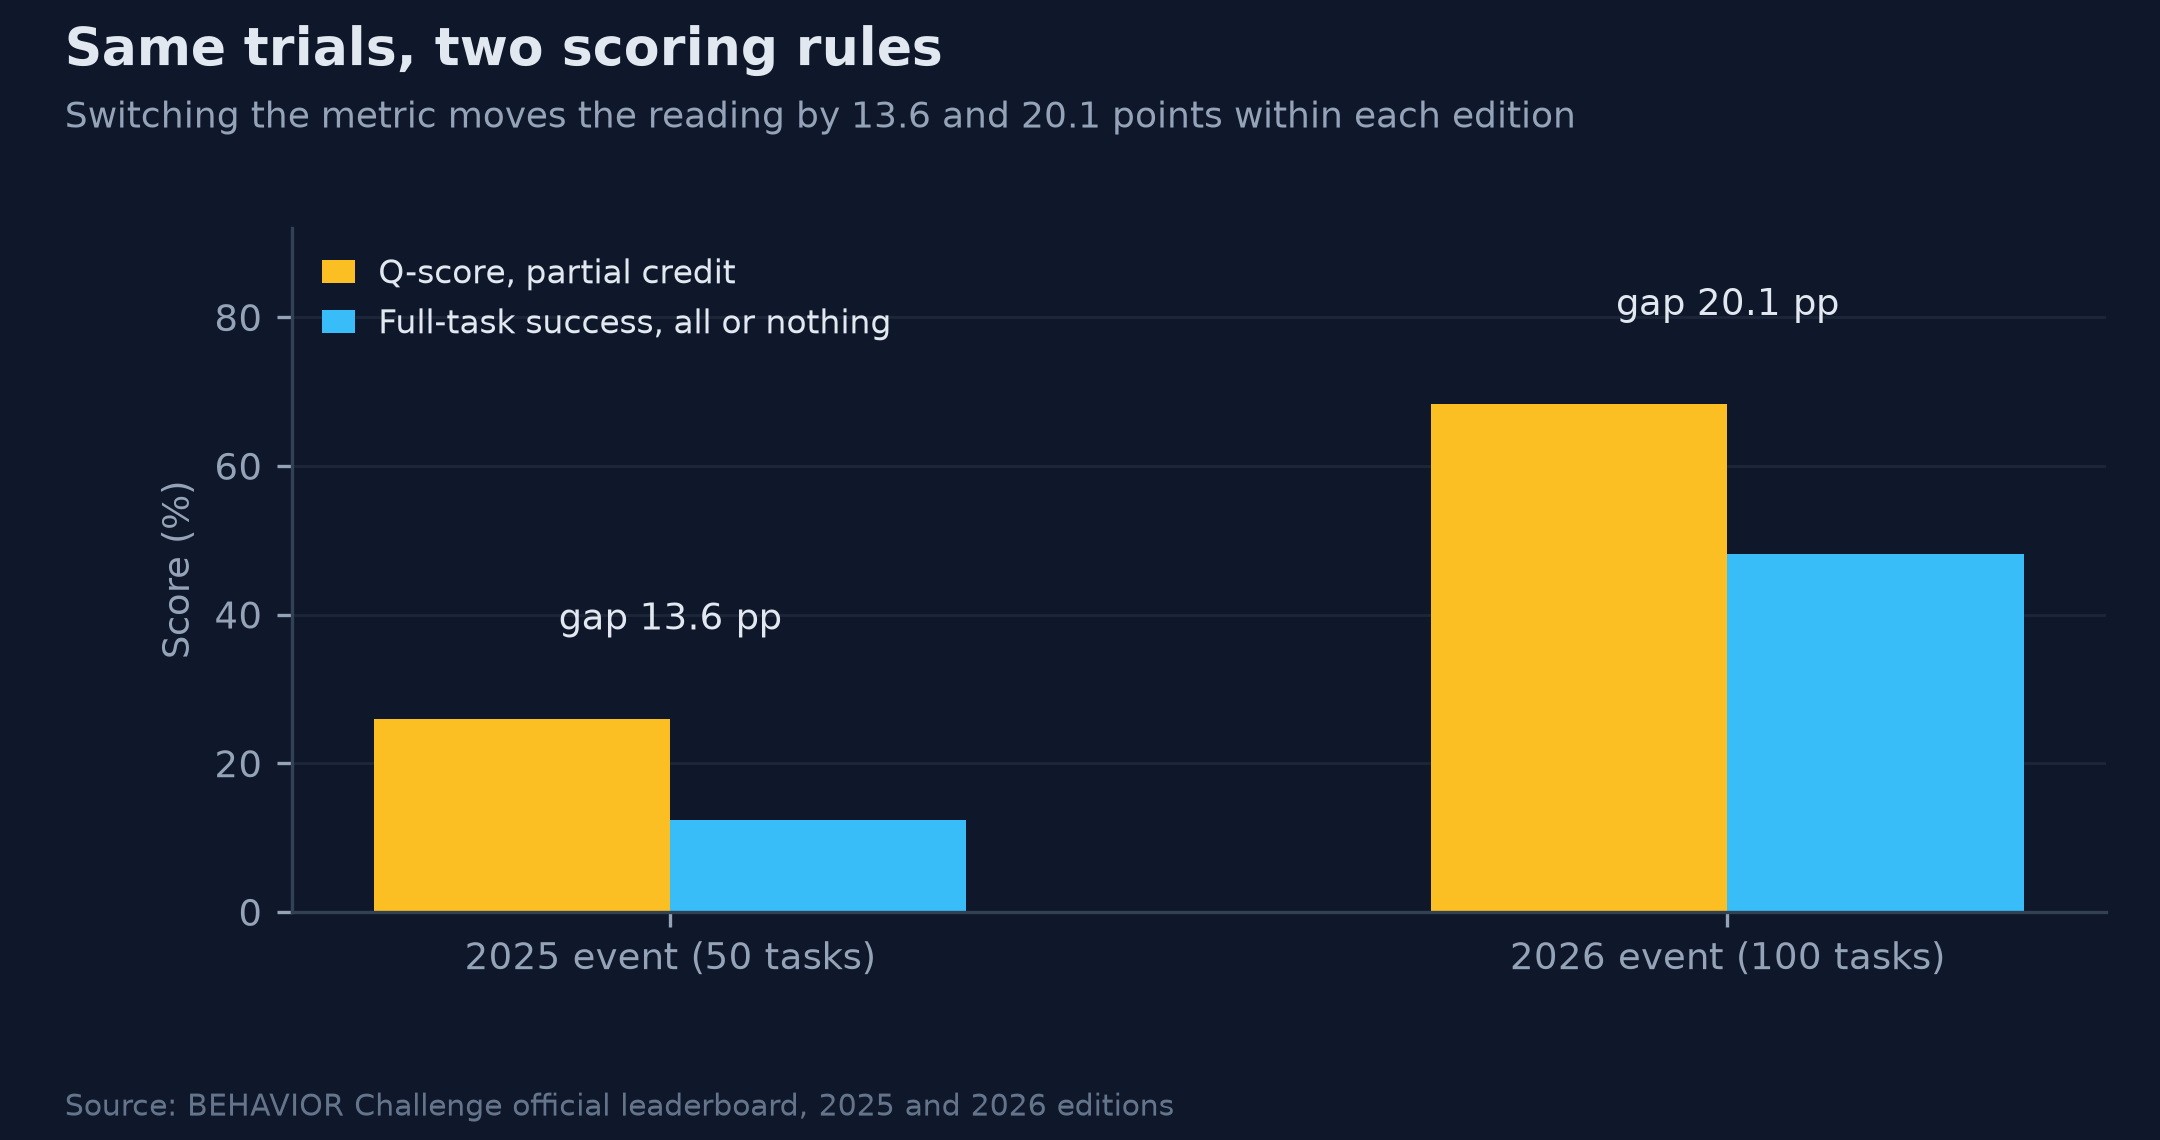
Fig 3 One batch of trials, two scoring rules
Source: BEHAVIOR Challenge leaderboard, 2025 and 2026 editions
2.4 What else the same benchmark contains
The 89.4% is not the only reading available from its own benchmark. It comes from a table in the EquAct paper. In that table, 100 demonstrations per task with planar motion gives 89.4, ten demonstrations gives 60.1, and ten demonstrations with 3-D motion gives 53.38AI Index Report 2026, technical performance chapterView the entry below →. Taking the highest cell matches the question the report set out to answer, which is how well the best method performs on that benchmark. When downstream citation treats the number as the benchmark's typical level, the other two configurations stop appearing.
The benchmark has also moved past 89.4%. In August 2026, under the same conditions of 100 demonstrations per task, BridgeVLA++ reported 93.7%, a team-released result with no third-party replication yet14arXiv, Aug 2026View the entry below →. The figure the industry has quoted for half a year was already behind the frontier when it became widely cited, and that lag inflates the picture of where the technology stands.
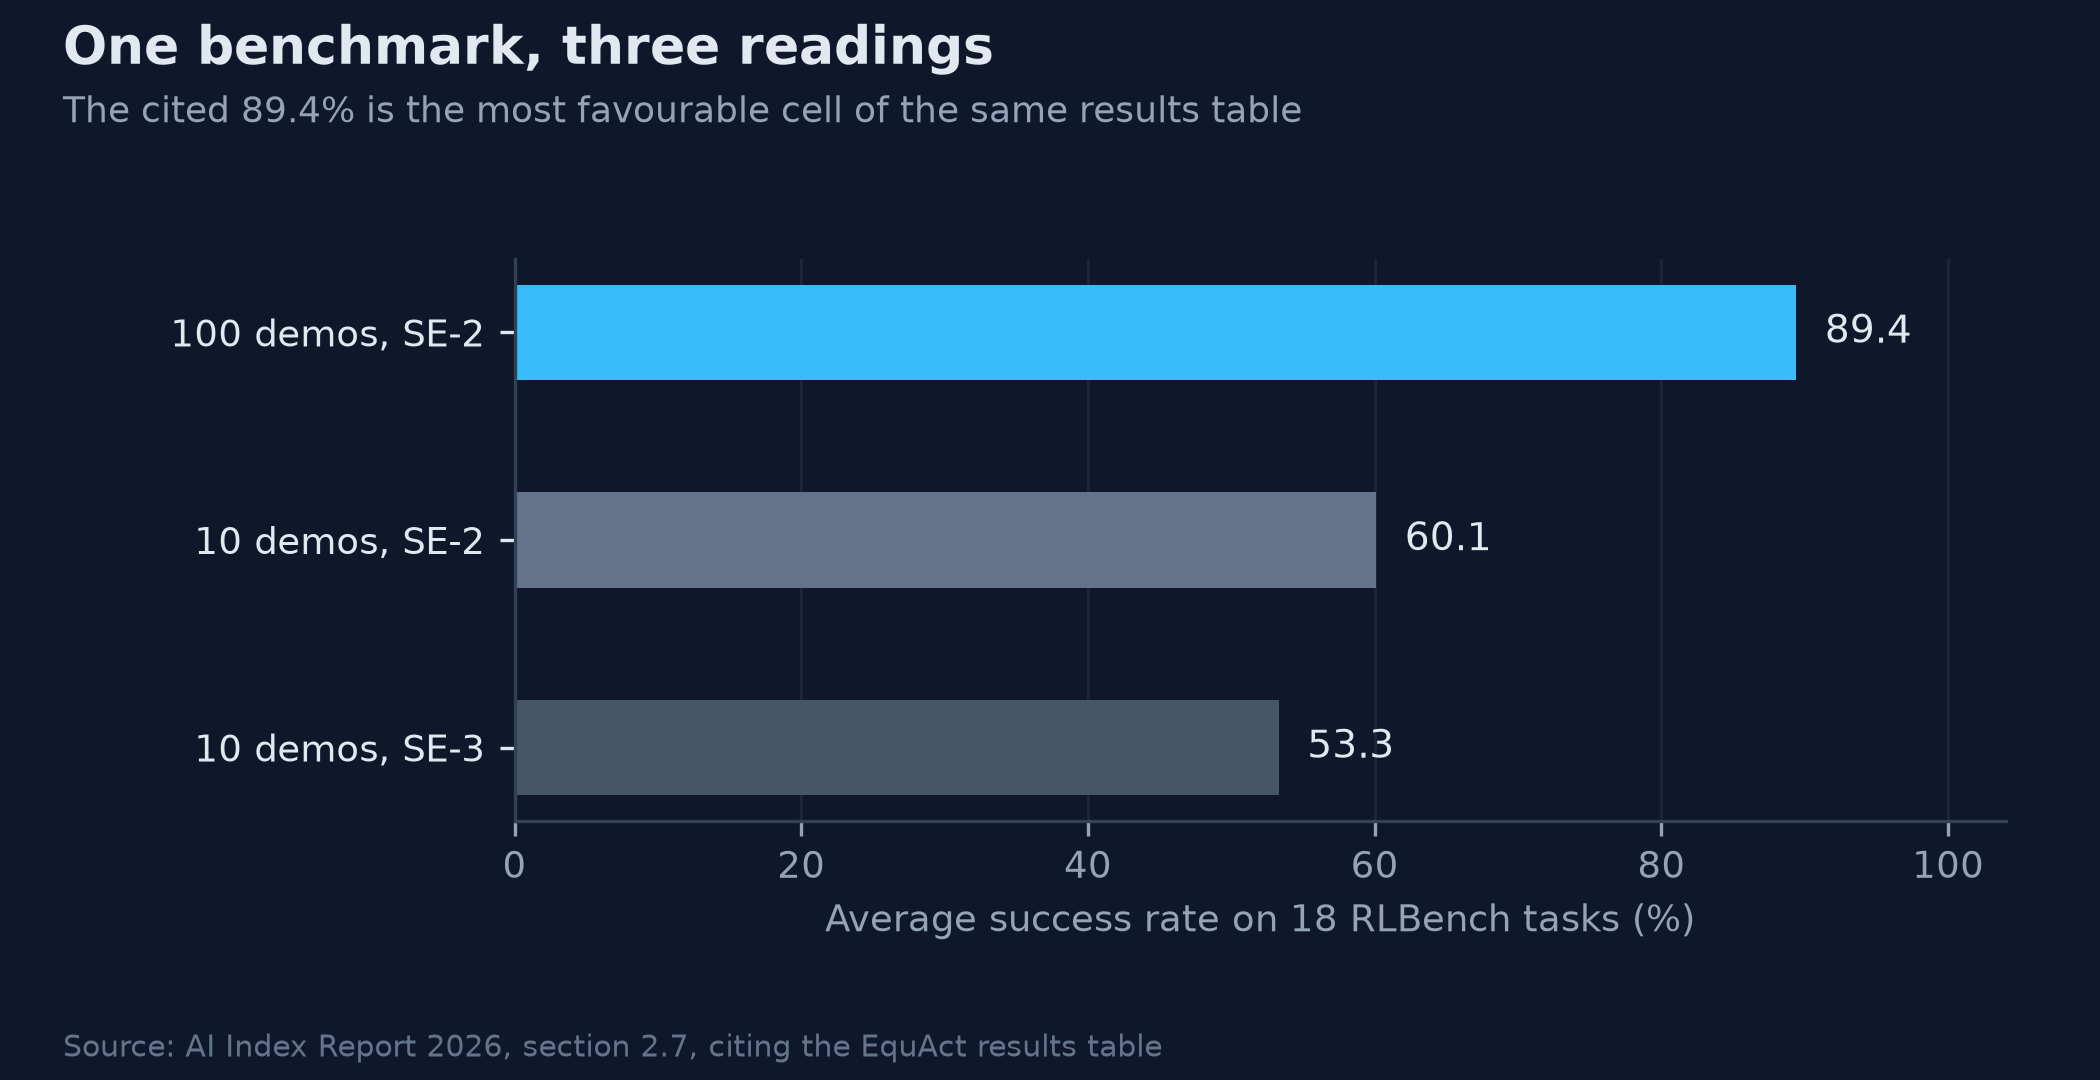
Fig 4 One benchmark, three readings from the same results table
Source: AI Index Report 2026, Section 2.7, citing the EquAct results table