Company Research Report: YOUIBOT, a Niche Champion's Revenue Mix
Why read: the gap between a 6.1% and a 0.3% share is a denominator, and the revenue table behind it was just redrawn by lithium battery.
By Embodied AI Frontier
Date: Oct 19, 2026
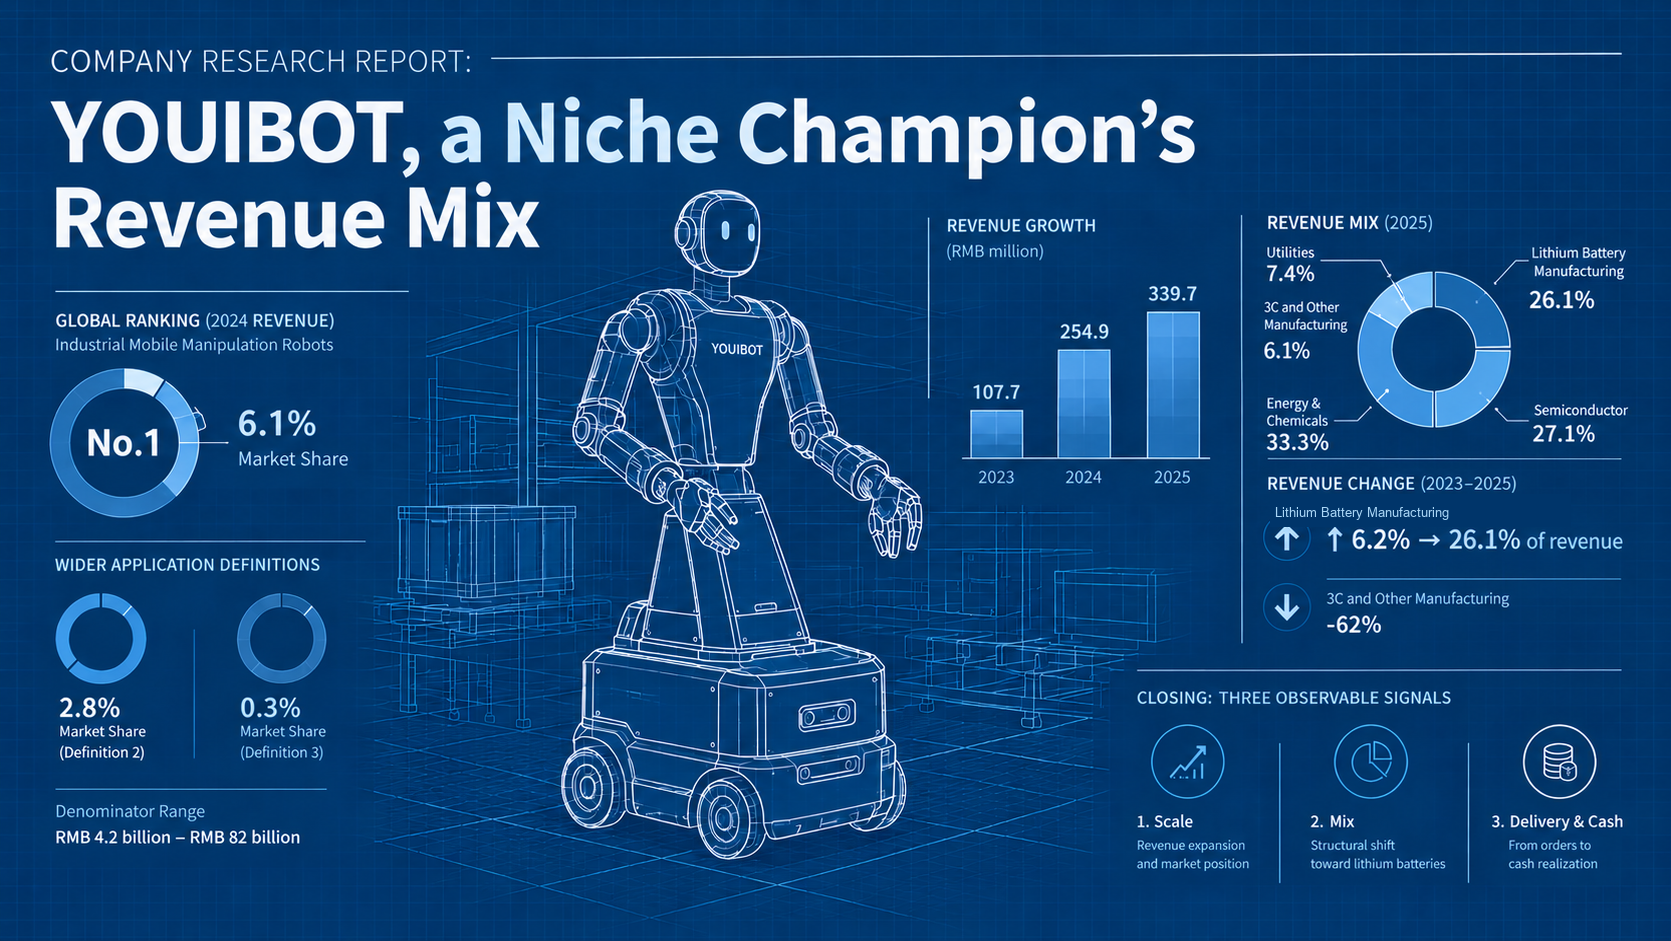
YOUIBOT filed for a Hong Kong listing under Chapter 18C, the exchange's regime for specialist technology companies, and cleared its filing with the China Securities Regulatory Commission in August 20262CSRCView the entry below →3Securities TimesView the entry below →. On 2024 revenue, the company ranks first worldwide in industrial mobile manipulation robots with a 6.1% share. The same application discloses 2.8% and 0.3% shares under two wider definitions, where the denominator runs from RMB 4.2 billion to RMB 82 billion. Revenue rose from RMB 107.7 million in 2023 to RMB 339.7 million in 2025, with the increase concentrated in lithium battery manufacturing while 3C (computers, communications and consumer electronics) and other manufacturing fell 62%. The scope runs from the boundary of the three denominators through the shift inside the revenue mix to the economics of delivery and cash. Overseas revenue is reported as everything outside the Chinese mainland and came to 6.3% of revenue in 2025. The closing section lists three observable signals.
Article structure
- 1. Conclusion: three denominators, one ruler
- 2. Demand: scenarios and market size
- 3. The company: team and organisational form
- 4. Product: what one brain across many forms can and cannot do
- 5. Customers: disclosure tiers and concentration
- 6. Supply chain: bought parts, written software
- 7. Competition: a lead inside a fragmented market
- 8. Financials: a revenue table redrawn by lithium battery
- 9. Substitutability: where switching costs sit
- 10. Variables: three observable signals
1. Conclusion: three denominators, one ruler
The Hong Kong application file carries three market shares, all measured on 2024 revenue. Under industrial mobile manipulation robots, YOUIBOT holds 6.1% globally and 12.0% in China, first in both. Under mobile manipulation robot solutions the global share is 2.8% and the rank fourth. Under embodied AI robot solutions as a whole, the share is 0.3% globally and 0.9% in China1HKEXView the entry below →. The three figures come from one document, and the gap between them comes from what each counts: the first divides by a RMB 4.2 billion slice, the third by a RMB 82 billion total, so the narrow number is less than 6% of the wide one (Figure 1). The same revenue produces shares about 20 times apart, which means any claim about this company's standing has to fix the denominator first.
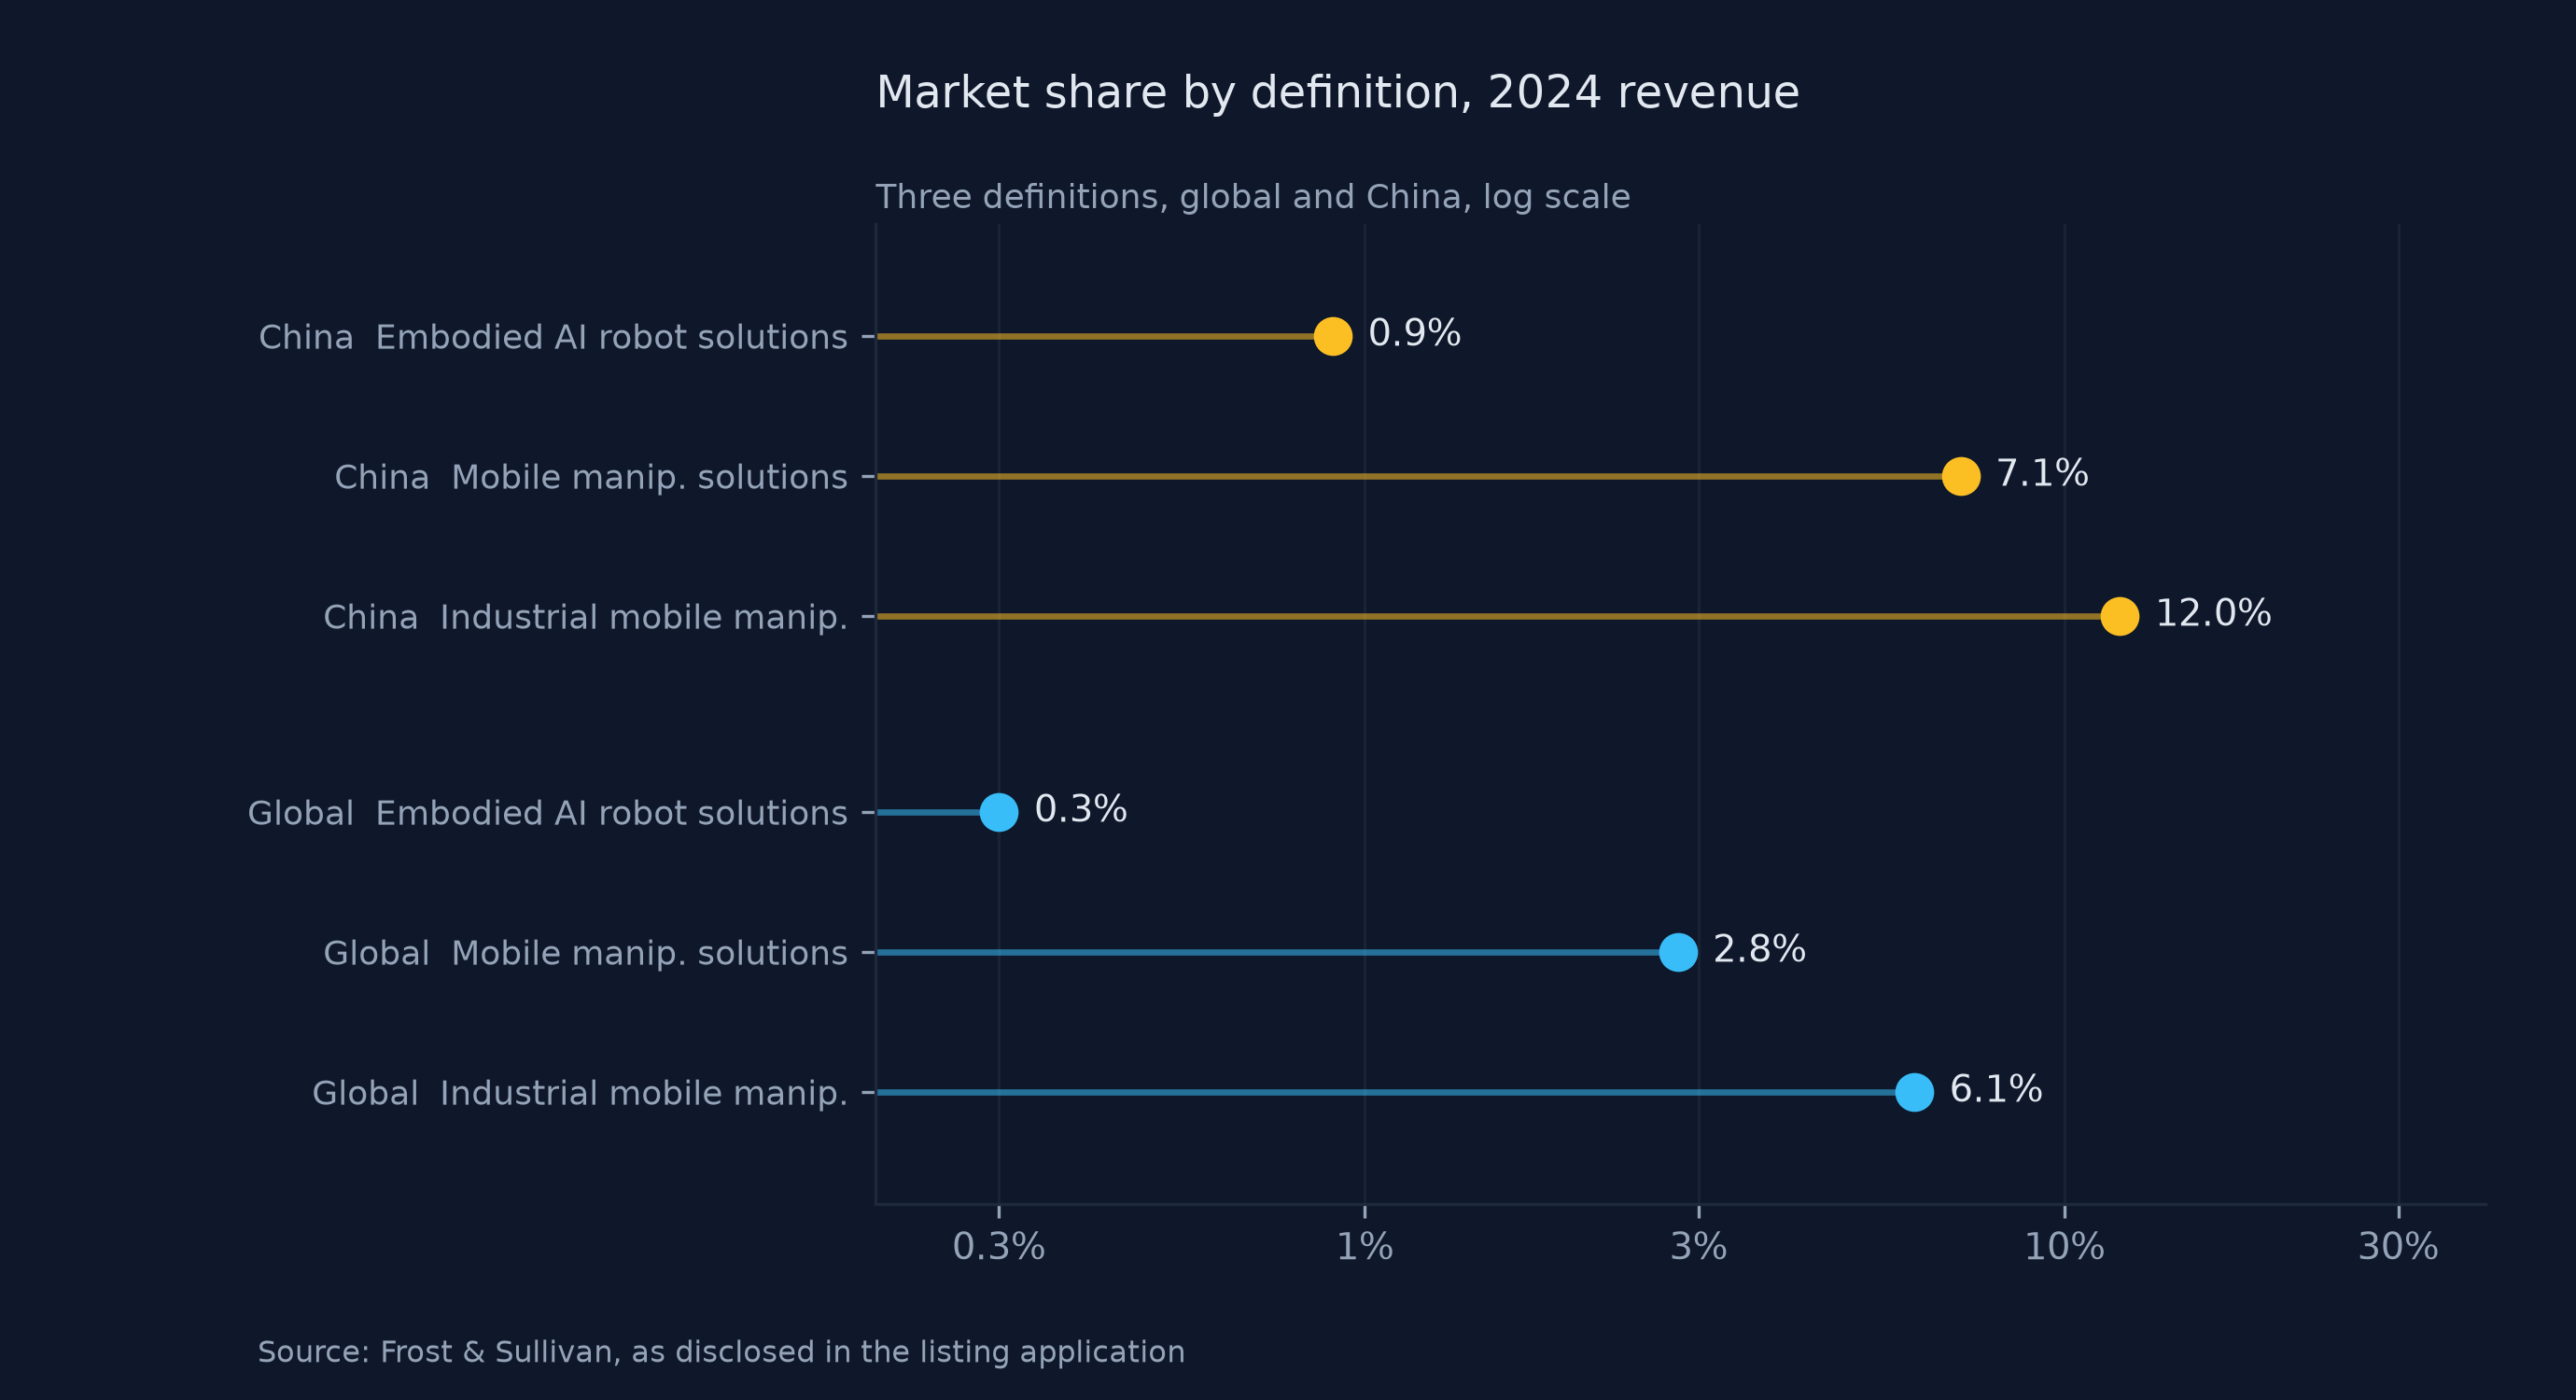
Fig 1 Market share under three definitions, global and China, 2024 revenue, log scale.
Source: HKEX listing application (31 Mar 2026), citing Frost & Sullivan.
A second set comes from the same source. Revenue reached RMB 339.7 million (about $47.2 million) in 2025, up 33.3% year on year, and the increase came almost entirely from lithium battery manufacturing, which moved from RMB 15.9 million in 2024 to RMB 88.7 million. Over the same window, 3C and other manufacturing fell from RMB 54.8 million to RMB 20.7 million1HKEXView the entry below →. Growth and a rearrangement of the mix happened together, and they mean different things for valuation: demand kept expanding while the source of that expansion was replaced.
Two inferences follow, and the next filing can test both. If lithium orders stop growing while 3C does not recover, the mix returns to its 2024 shape, which the vertical table in the next filing will show. If lithium demand holds and humanoids start producing recognised revenue, the mix keeps its current tilt.
Two uncertainties should be stated plainly. The largest customer rose from 7.2% of revenue in 2024 to 20.4% in 2025, and reached 25.0% in the first half of 20255Securities DailyView the entry below →, so where that share goes next decides who owns the growth. The 4,000-unit humanoid order signed in June 2026 is an intent, not a confirmed order, and the company has disclosed neither the terms of conversion nor a timetable6Shanghai Securities NewsView the entry below →7ECCNView the entry below →.
2. Demand: scenarios and market size
2.1 What customers actually buy
The portfolio splits by scenario. Industrial logistics moves material inside a plant, from kitting and line-side buffers through to finished goods, and the buyers are wafer fabs, packaging and test houses, battery plants and 3C manufacturers. Inspection and maintenance covers monitoring and intervention at high-risk facilities, and the buyers are grid operators, power generators, chemical plants and data centres1HKEXView the entry below →10YouibotView the entry below →. In 2025, energy and chemicals, semiconductors and lithium battery together produced 86% of revenue1HKEXView the entry below →.
Quantified customer benefit is not disclosed. The filing gives no headcount, yield or incident rate before and after a deployment, and the case studies on the company site stay qualitative, covering the replacement of people in hazardous areas and continuous inspection of more than 1,400 critical points10YouibotView the entry below →. Those are company claims without third-party verification, so the gap stays open rather than being filled with an industry average.
2.2 The alternatives and where the product stops
A customer that does not buy this class of equipment has three options. It can keep a manual crew. It can buy a mobile robot that only moves loads and leave the grasping to people. It can install fixed arms and dedicated machinery, which manipulate without moving. The last two split mobility and manipulation into two separate purchases.
A comparison table inside the filing sets the boundary. Comparable products position to greater than plus or minus 50 millimetres and to plus or minus 10 millimetres; the OW series holds 5 millimetres and covers the full semiconductor flow, while one comparable covers packaging only and the other stops at material handling for 3C1HKEXView the entry below →. The table was compiled by the company's industry adviser, so it can be cited only as the company's own position.
2.3 Constraints and what would satisfy them
The constraints are fragmented sites and deep integration. Every plant layout differs, so a robot has to be wired into line control, warehouse management and the manufacturing execution system, then have its routes calibrated on site. The filing puts delivery from order to customer acceptance at 250 to 300 days1HKEXView the entry below →, a number that both measures the fragmentation and shows delivery remains mostly an on-site project.
Three proxy indicators show what would have to be true for that to change. On modularity, the product page states that the P series chassis accepts more than ten top-mounted modules, so one base can carry different end effectors. On repeat purchase, the 2025 rates were 75% in semiconductors, 100% in lithium battery and 78% in 3C and other manufacturing1HKEXView the entry below →. On cycle time, a shorter delivery window would support the inference that integration cost is falling. The company gives no payback threshold and no quantified buying standard from customers.
2.4 Three layers of market size
Market size uses Frost & Sullivan data cited in the filing, and the three layers have to be listed apart. Industrial mobile manipulation robot solutions were worth RMB 4.2 billion in 2024 and are forecast at RMB 32.9 billion in 2030. China accounts for RMB 2.0 billion, forecast at RMB 17.6 billion. The rest of the world accounts for RMB 2.2 billion, forecast at RMB 15.3 billion1HKEXView the entry below →. The two wider definitions, mobile manipulation robot solutions and embodied AI robot solutions overall, were worth RMB 9.2 billion and RMB 82 billion (about $11.4 billion) globally in 2024, and are forecast at RMB 156.9 billion and RMB 367.4 billion by 20301HKEXView the entry below →. Figure 2 charts only the three global definitions, and the China split stays in the text.
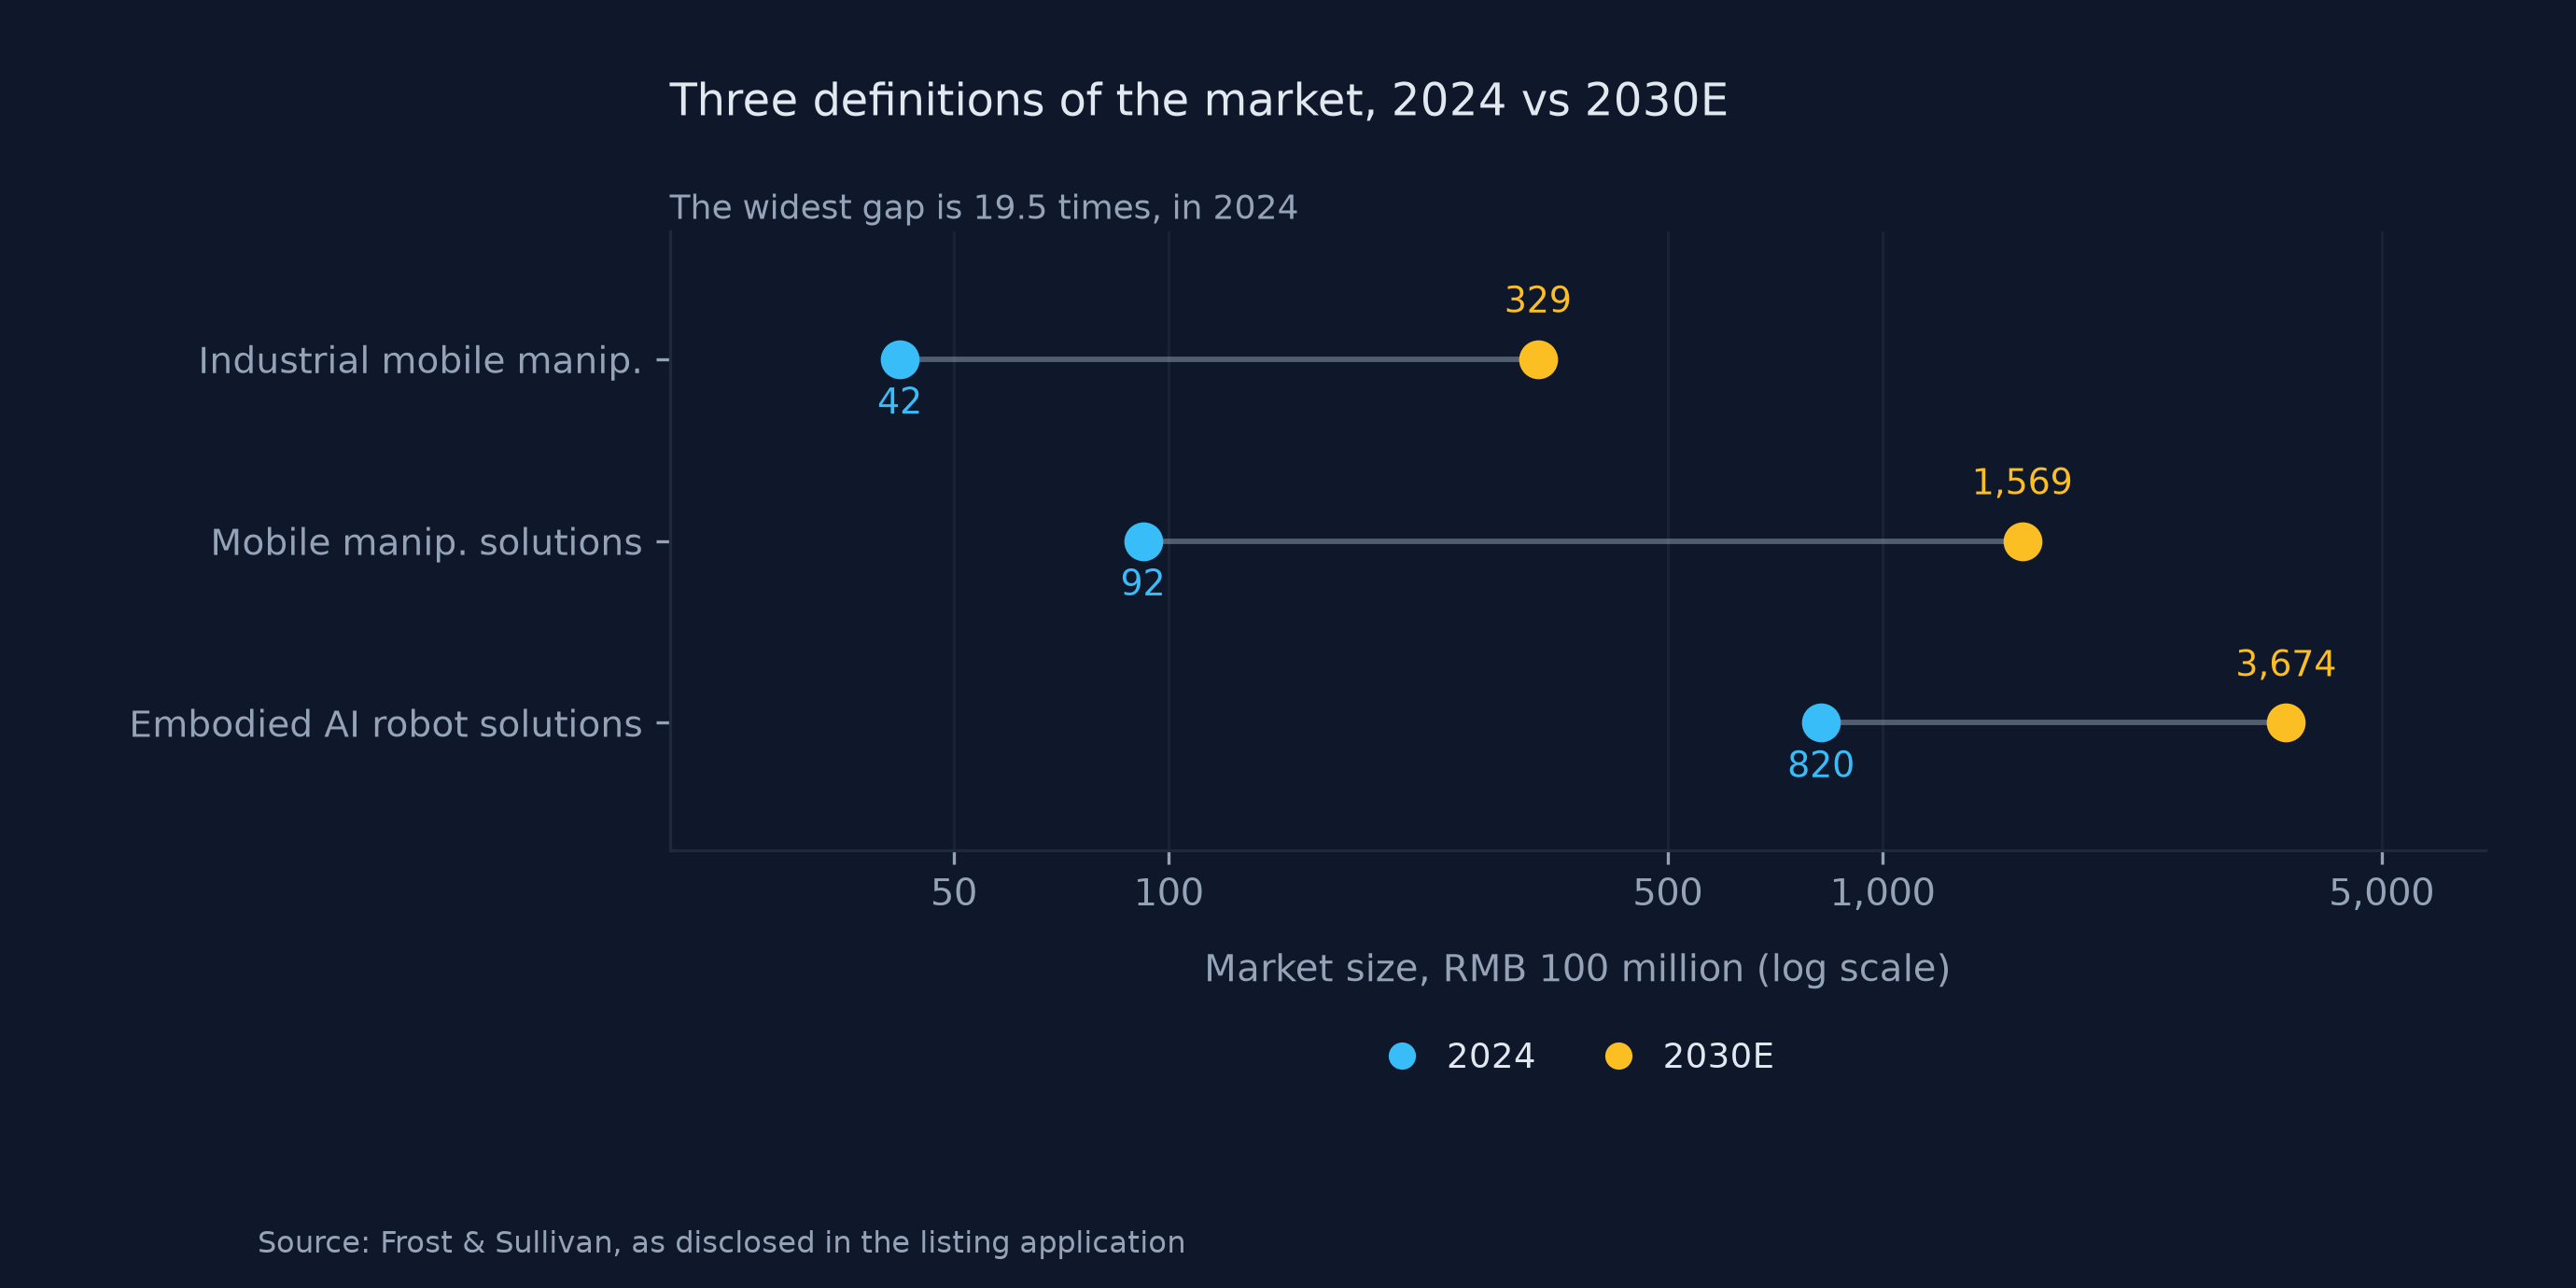
Fig 2 Three definitions of the market, 2024 and 2030E, global, log scale.
Source: Frost & Sullivan, as disclosed in the listing application.
Table 1: Market size, the values used, and what changes at the boundary
| Layer | 2024 value | What changes at the boundary |
|---|---|---|
| TAM (global) | RMB 4.2bn | On the wider definition the share drops from 6.1% to 2.8% |
| SAM (China) | RMB 2.0bn | Leaving the split out counts overseas as already addressable |
| SAM (ex-China) | RMB 2.2bn | Overseas penetration is about 0.7%, so reach and starting point must be shown apart |
| SOM (China) | 12.0% | Substituting the global share hides the overseas starting point |
| SOM (ex-China) | about 0.7% | On 2025 overseas revenue it reaches 1.0%, about one twelfth of the mainland figure |
TAM, SAM and SOM denote total, serviceable and obtainable market. Source: Frost & Sullivan, as disclosed in the filing1HKEXView the entry below →. More than 90% of revenue comes from the mainland. The overseas SOM divides 2024 overseas revenue of RMB 14.8 million by the RMB 2.2 billion market outside China.
The endpoint arithmetic can be reworked line by line. Take RMB 240 million divided by RMB 2.0 billion for 12.0%, RMB 14.8 million divided by RMB 2.2 billion for 0.7%, add the two and divide by RMB 4.2 billion for 6.07%, which lands on the disclosed 6.1%. Overseas revenue is reported as everything outside the Chinese mainland and rose from RMB 5.9 million to RMB 21.4 million over three years, moving from 5.5% to 6.3% of revenue1HKEXView the entry below →, which shows a small base still expanding. Overseas penetration on the latest year is 1.0%, roughly one twelfth of the mainland figure. A sensitivity check does not change the direction. The parts that cannot be reconciled should be named: the company reports one overseas total and no country split, so the size of Japan, Thailand and Germany separately cannot be established.
2.5 The rhythm of demand
Order counts say more about demand than revenue does. Orders ran at 233, 309 and 402 from 2023 to 2025. By vertical, semiconductors went from 35 to 93, lithium battery from 16 to 27, energy and chemicals from 47 to 91, utilities from 24 to 75, and 3C and other manufacturing held near a hundred (Figure 3)1HKEXView the entry below →.
What this shows is a rearrangement rather than an expansion. 3C orders barely moved while revenue fell 62%, which points to smaller projects or lower configurations. Lithium orders went from 13 to 27 while revenue reached 5.6 times its 2024 level, rising from RMB 15.9 million to RMB 88.7 million, which points to larger projects. The spread of project sizes across two industries is wide enough to reshape the whole revenue table. Order growth and revenue growth moved in the same direction for different reasons, so reading the total as a business cycle would mislead.
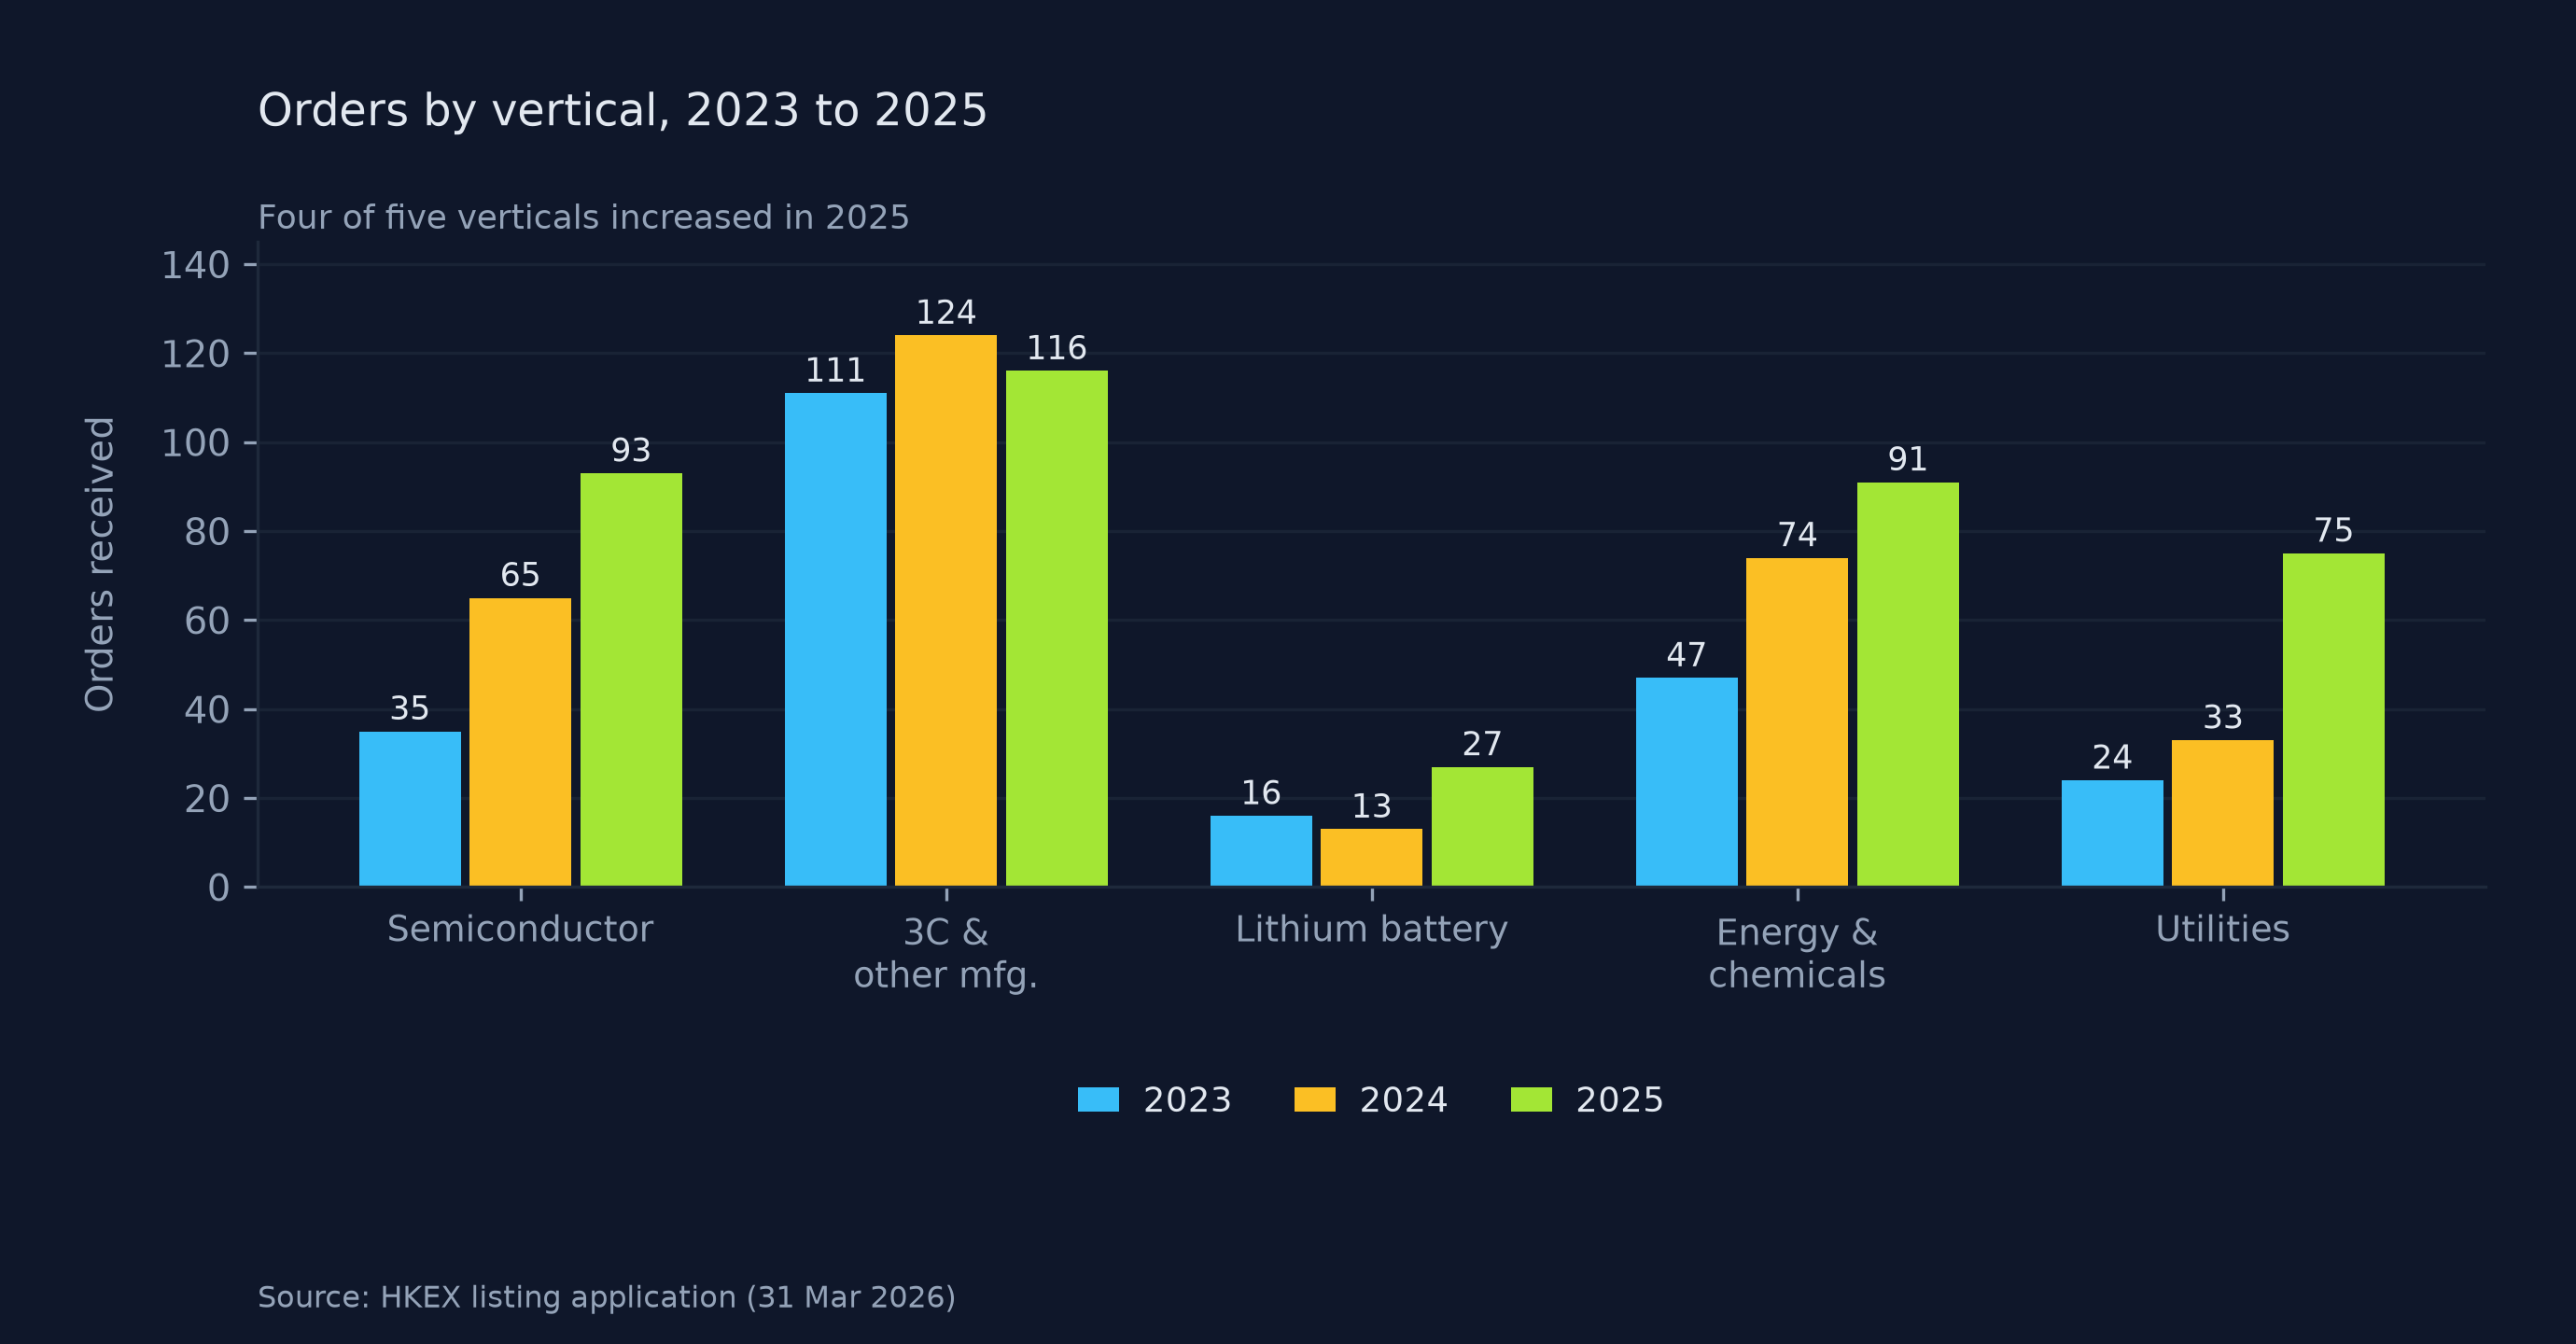
Fig 3 Orders by vertical, 2023 to 2025.
Source: HKEX listing application (31 Mar 2026).
3. The company: team and organisational form
YOUIBOT was incorporated in May 2017 in Hefei, converted in September 2025 into a joint-stock company, the corporate form Chinese firms adopt before a domestic listing, and is applying under Chapter 18C, the Hong Kong rule set for specialist technology companies, with China International Capital Corporation (CICC) as sole sponsor1HKEXView the entry below →. Manufacturing runs at Hefei, Huzhou and Shenzhen, and the Shenzhen plant stopped production in the first half of 2023. Overseas, the company holds subsidiaries in Hong Kong and Japan, and Japan runs its own sales team1HKEXView the entry below →.
The core team comes out of robotics at Xi'an Jiaotong University. Founder Zhang Zhaohui holds 8.80% directly and 15.61% through Xi'an Youibot, and acts in concert with Mei Xuesong, Bian Xu and an employee platform to control roughly 30%1HKEXView the entry below →4Sina FinanceView the entry below →. Research is led by Bian Xu, Xu Jin and Zhao Wanqiu, and the company runs a joint embodied AI institute with the university that publishes the humanoid line13Xi'an Jiaotong UniversityView the entry below →.
At the end of 2025 the company employed 419 people full time, 141 of them in research and 80 in project delivery and service1HKEXView the entry below →. Delivery and service is close to 60% of the research headcount, which fits a delivery cycle above 250 days and shows the thing being sold is a project with on-site work attached. A unit that works out of the box is not the main product, and that decides how revenue is recognised, how gross margin behaves and how cash comes back.
4. Product: what one brain across many forms can and cannot do
4.1 Three product lines
Industrial logistics centres on the OW series, in four models, OW12, OW8, OWC and OWM, built for wafer carrier handling, with the ATS series covering complex transfers and the L and C series carrying heavy loads for 3C and lithium battery plants1HKEXView the entry below →. Inspection and maintenance uses the ARIS series in four configurations: switchgear room operation, indoor wheeled, rail-mounted and outdoor wheeled, with IP66 and Ex db eb IIC T6 Gb protection stated on the product page10YouibotView the entry below →.
The performance figures in the filing stop at positioning. The OW series holds plus or minus 5 millimetres and 1.5 metres per second, and the ARIS series holds plus or minus 10 millimetres with four-wheel drive1HKEXView the entry below →. Placing those numbers on an industry scale needs published values from comparable products, and the company's own table covers only four items: positioning, top speed, drive type and visual localisation. Payload, endurance, repeatability and mean time between failures are all missing. What can be established is a list of demonstrated capabilities; an ordering against peers has no basis yet.
4.2 The boundary of one brain, many forms
The company describes its architecture as One Brain, Many Forms. The brain is MAIC, an industrial embodied model handling perception, decisions, interaction and fleet coordination, which the company says controls joints across body types in real time through reinforcement learning. The forms come from common building blocks combined into different robots1HKEXView the entry below →. In June 2026 the company released FabriX, an industrial foundation model, and set a target of 10,000 industrial sites within three years6Shanghai Securities NewsView the entry below →.
Verified and unverified parts have to be separated. On the verified side, scheduling software ships with each project, robots of different shapes are managed inside one system, and five humanoid robots worked with one mobile robot on line-side picking in a public demonstration at WAIC in July 20268Securities TimesView the entry below →. On the unverified side sit every quantitative claim about the model. Neither the filing nor the launch material carries third-party evaluation, and the company has not said whether MAIC and FabriX replace each other or run in parallel. Until that relationship is clarified, the boundary of the brain can only be recorded as the company states it.
4.3 Where the humanoids sit
Humanoids arrived after 2025 and carry no separate revenue line. Lingshu, a bipedal humanoid, made its debut in Hefei in August 2025 with 33 degrees of freedom and a 40 kilogram body11YouibotView the entry below →. On 29 June 2026 the company released Edge, an industrial humanoid, and published prices: RMB 299,000 for the standard model and RMB 499,000 for the advanced one7ECCNView the entry below →. Eight ecosystem partners signed letters of intent for 4,000 units at the launch, and no correspondence between that number and eventual deliveries exists yet6Shanghai Securities NewsView the entry below →.
Those 4,000 units have to be read for what they are. The signatories are ecosystem partners, the instrument is an intent, and no value is attached. Production, deployment, acceptance and collection all sit between signature and recognised revenue, and the company's own delivery cycle runs beyond 250 days1HKEXView the entry below →. The company has disclosed neither the model mix nor any discount on those units, so no total is converted here. The figure describes future capacity and channels rather than an order book, and confusing the two distorts the size of the business.
5. Customers: disclosure tiers and concentration
5.1 Who can be named
Two customers can be named. Michelin bought ARIS-V units in 2018 for commercial tyre inspection, an order in the millions of renminbi12Cailian PressView the entry below →. China Southern Power Grid's Guangzhou supply bureau runs an inspection deployment in regular operation, disclosed in a joint release with Huawei Cloud in September 20269GasgooView the entry below →. Both carry public confirmation from a media outlet or a partner, so both are checkable links in a delivery chain.
Everyone else appears as Customer A through Customer M, with industry, company size and model purchased but no name. On that basis the top five sit in lithium battery manufacturing, electromechanical and electronic equipment, consumer electronics manufacturing, industrial robot integration, and digital forensics with digital government services1HKEXView the entry below →. Cumulatively, by the end of 2025 the company had supplied more than 400 enterprises across five industries1HKEXView the entry below →. The anonymity is the issuer's choice rather than a gap in the record, and mapping those letters back to named firms would be speculation, so it is not attempted.
5.2 Concentration
Customer concentration is the largest single movement in this file (Figure 4). The biggest customer held 10.5% of revenue in 2023, 7.2% in 2024 and 20.4% in 2025; the top five together held 28.3%, 29.9% and 35.8%1HKEXView the entry below →. On the first half of 2025 the figure ran higher still, with one customer reaching 25.0%, which shows concentration was still climbing during the year5Securities DailyView the entry below →.
Concentration rose at the same time as revenue, and the source points to lithium projects. The company says the top five do not amount to a material concentration risk because their shares are close1HKEXView the entry below →. In 2025 the top two pulled apart, at 20% of revenue against 4% for the second largest. One customer producing a fifth of revenue matters in a project business with delivery cycles near nine months. This is an observable structural feature rather than a problem that has already occurred, and the distinction decides whether it belongs among observations or findings.
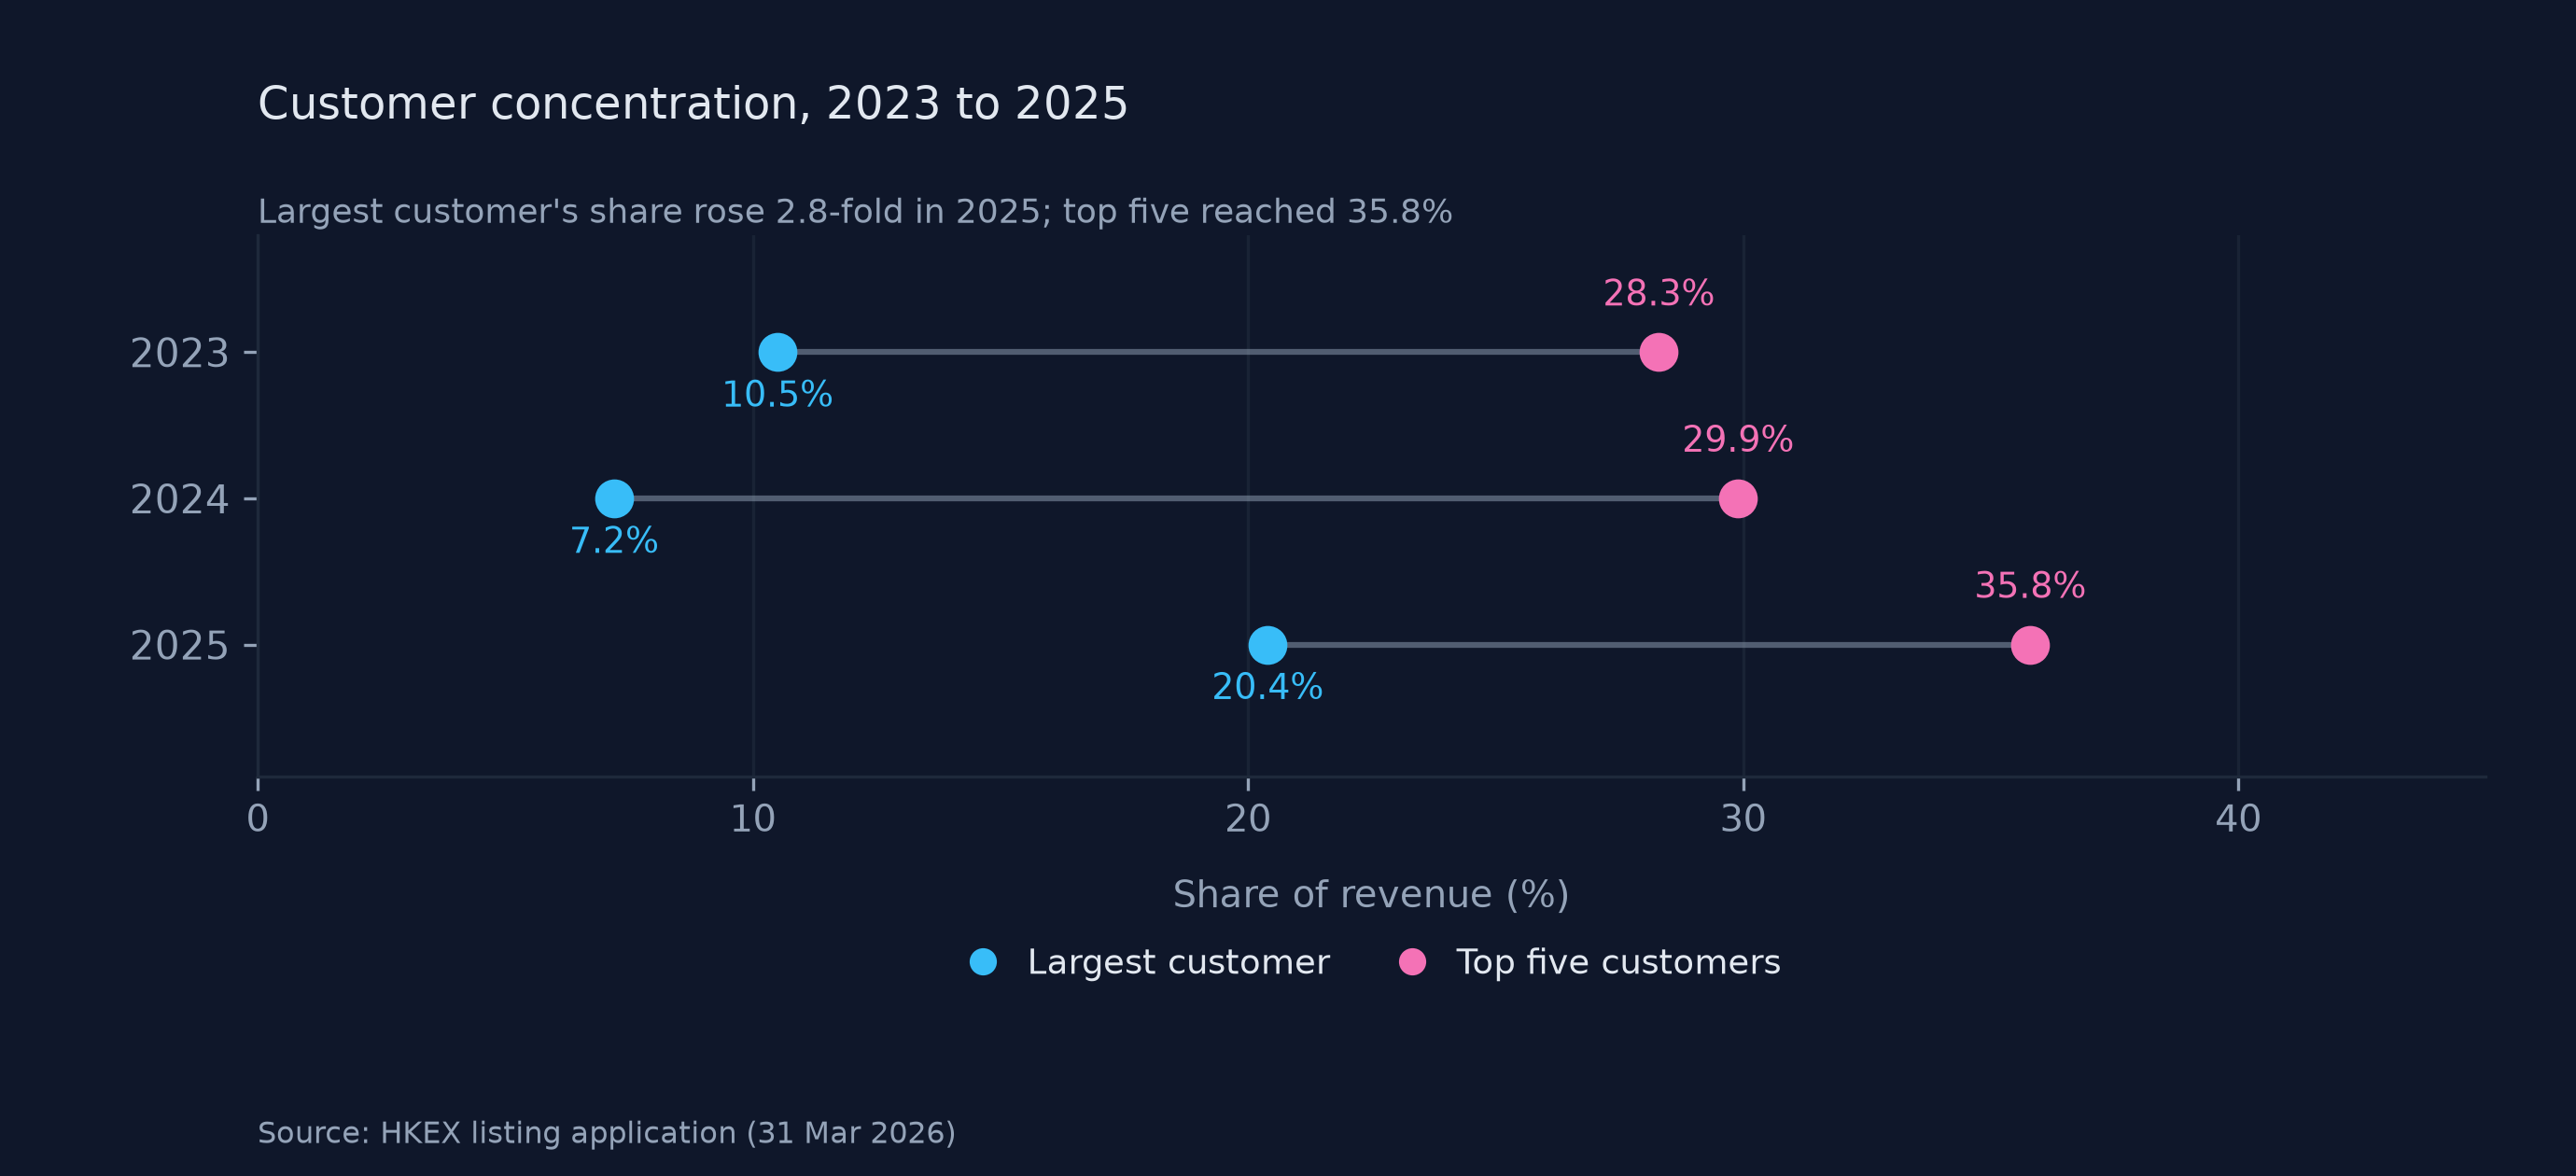
Fig 4 Largest customer and top five as a share of revenue, 2023 to 2025.
Source: HKEX listing application (31 Mar 2026).
6. Supply chain: bought parts, written software
The filing lists what is bought and where it comes from. Machined and sheet metal parts come from one precision processor in Dongguan, lidar and sensors from Suzhou, drive modules from five places across Qingdao, Wuhan, Guangzhou, Suzhou and Anhui, robotic arms from a collaborative robot maker in Shanghai, and structural modules from Suzhou1HKEXView the entry below →.
Concentration has fallen for three years. The top five suppliers moved from 33.2% to 19.4% of purchases and the largest single supplier fell in step1HKEXView the entry below →, which shows purchasing concentration coming down systematically. The company explains this by keeping several qualified suppliers in parallel and by signing long-term agreements with core suppliers that carry price bands or price locks1HKEXView the entry below →, which is itself an admission that dependence on any one supplier was a concern. The practical effect is a smaller bargaining weight for each supplier, so security of supply and cost control pull against each other here.
In-house work concentrates on software and controllers. The filing lists multi-sensor fusion positioning, cross-map path planning, omnidirectional drive control and multi-joint grasping1HKEXView the entry below →. What stays undisclosed on the hardware side is the model and share of in-house content in reducers, servos and lidar. Without that, it is impossible to say whether cost advantage comes from design or from purchasing.
Two channels run downstream. Domestically the company sells direct and through integrators, and two of its 2025 top five customers are integrators; overseas it sells through distributors and runs its own team only in Japan1HKEXView the entry below →. On the complement side the clearest relationship is Huawei Cloud, with a joint CloudRobo embodied inspection release in September 2026 and a place in Huawei Cloud's industry AI programme9GasgooView the entry below →.
7. Competition: a lead inside a fragmented market
The first thing to note about this market is how fragmented it is. On 2024 revenue the global top five in industrial mobile manipulation held 15.3% between them, and YOUIBOT led with 6.1%, about three points ahead of the second1HKEXView the entry below →. China is somewhat tighter, with the top five on 24.0% and YOUIBOT leading on 12.0% against 6.0% for the second1HKEXView the entry below →. A three point gap at the top means the lead is real but narrow.
Competitors stay anonymous in the filing, as Company A through Company I, with founding year, headquarters and business description only. From those profiles, three of the global top four in mobile manipulation solutions are headquartered in the United States, working on industrial automation, warehouse humanoids and autonomous humanoids. Of the top five, two sit in mainland China, the company among them, and the other serves consumer and industrial markets1HKEXView the entry below →. The anonymity is standard practice for industry advisers, so identity cannot be established and no de-anonymisation is used.
Judged by what competes for the same budget, the field has three layers. Direct competition comes from other industrial mobile manipulation vendors, compared on lead time, fit to the site and industry knowledge. Indirect competition comes from robots that only move, from fixed arms and from dedicated machinery, compared on unit price and the cost of retrofitting. Substitutes are keeping manual crews and postponing automation, compared on payback. The company sits differently in each layer: first by share with a narrow margin at the direct layer, arguing the case for combining movement and manipulation at the indirect layer, and answering payback uncertainty at the substitute layer.
8. Financials: a revenue table redrawn by lithium battery
8.1 Revenue mix
Revenue reached 3.2 times its 2023 level in 2025, at RMB 339.7 million against RMB 107.7 million, a compound rate near 78%1HKEXView the entry below →. The mix moved more than the total (Figure 5). Energy and chemicals was the largest block in 2024 at 37%, stayed first in 2025 at 33.3%, and semiconductors held second place at 27.1%. Lithium battery went from 6.2% to 26.1%, while 3C and other manufacturing fell from 21.5% to 6.1%1HKEXView the entry below →.
By scenario, industrial logistics contributed RMB 201.7 million in 2025, or 59.4%, with inspection and maintenance taking 40.6%1HKEXView the entry below →. Profitability differs sharply between the two: gross margin was 28.6% in industrial logistics and 48.1% in inspection, against 36.5% overall, up from 26.1% three years earlier, driven by a larger share of high-margin semiconductor and energy projects and by the growth of inspection. The improvement came from the business mix rather than from pricing power, and that distinction decides whether the trend depends on which industries grow next.
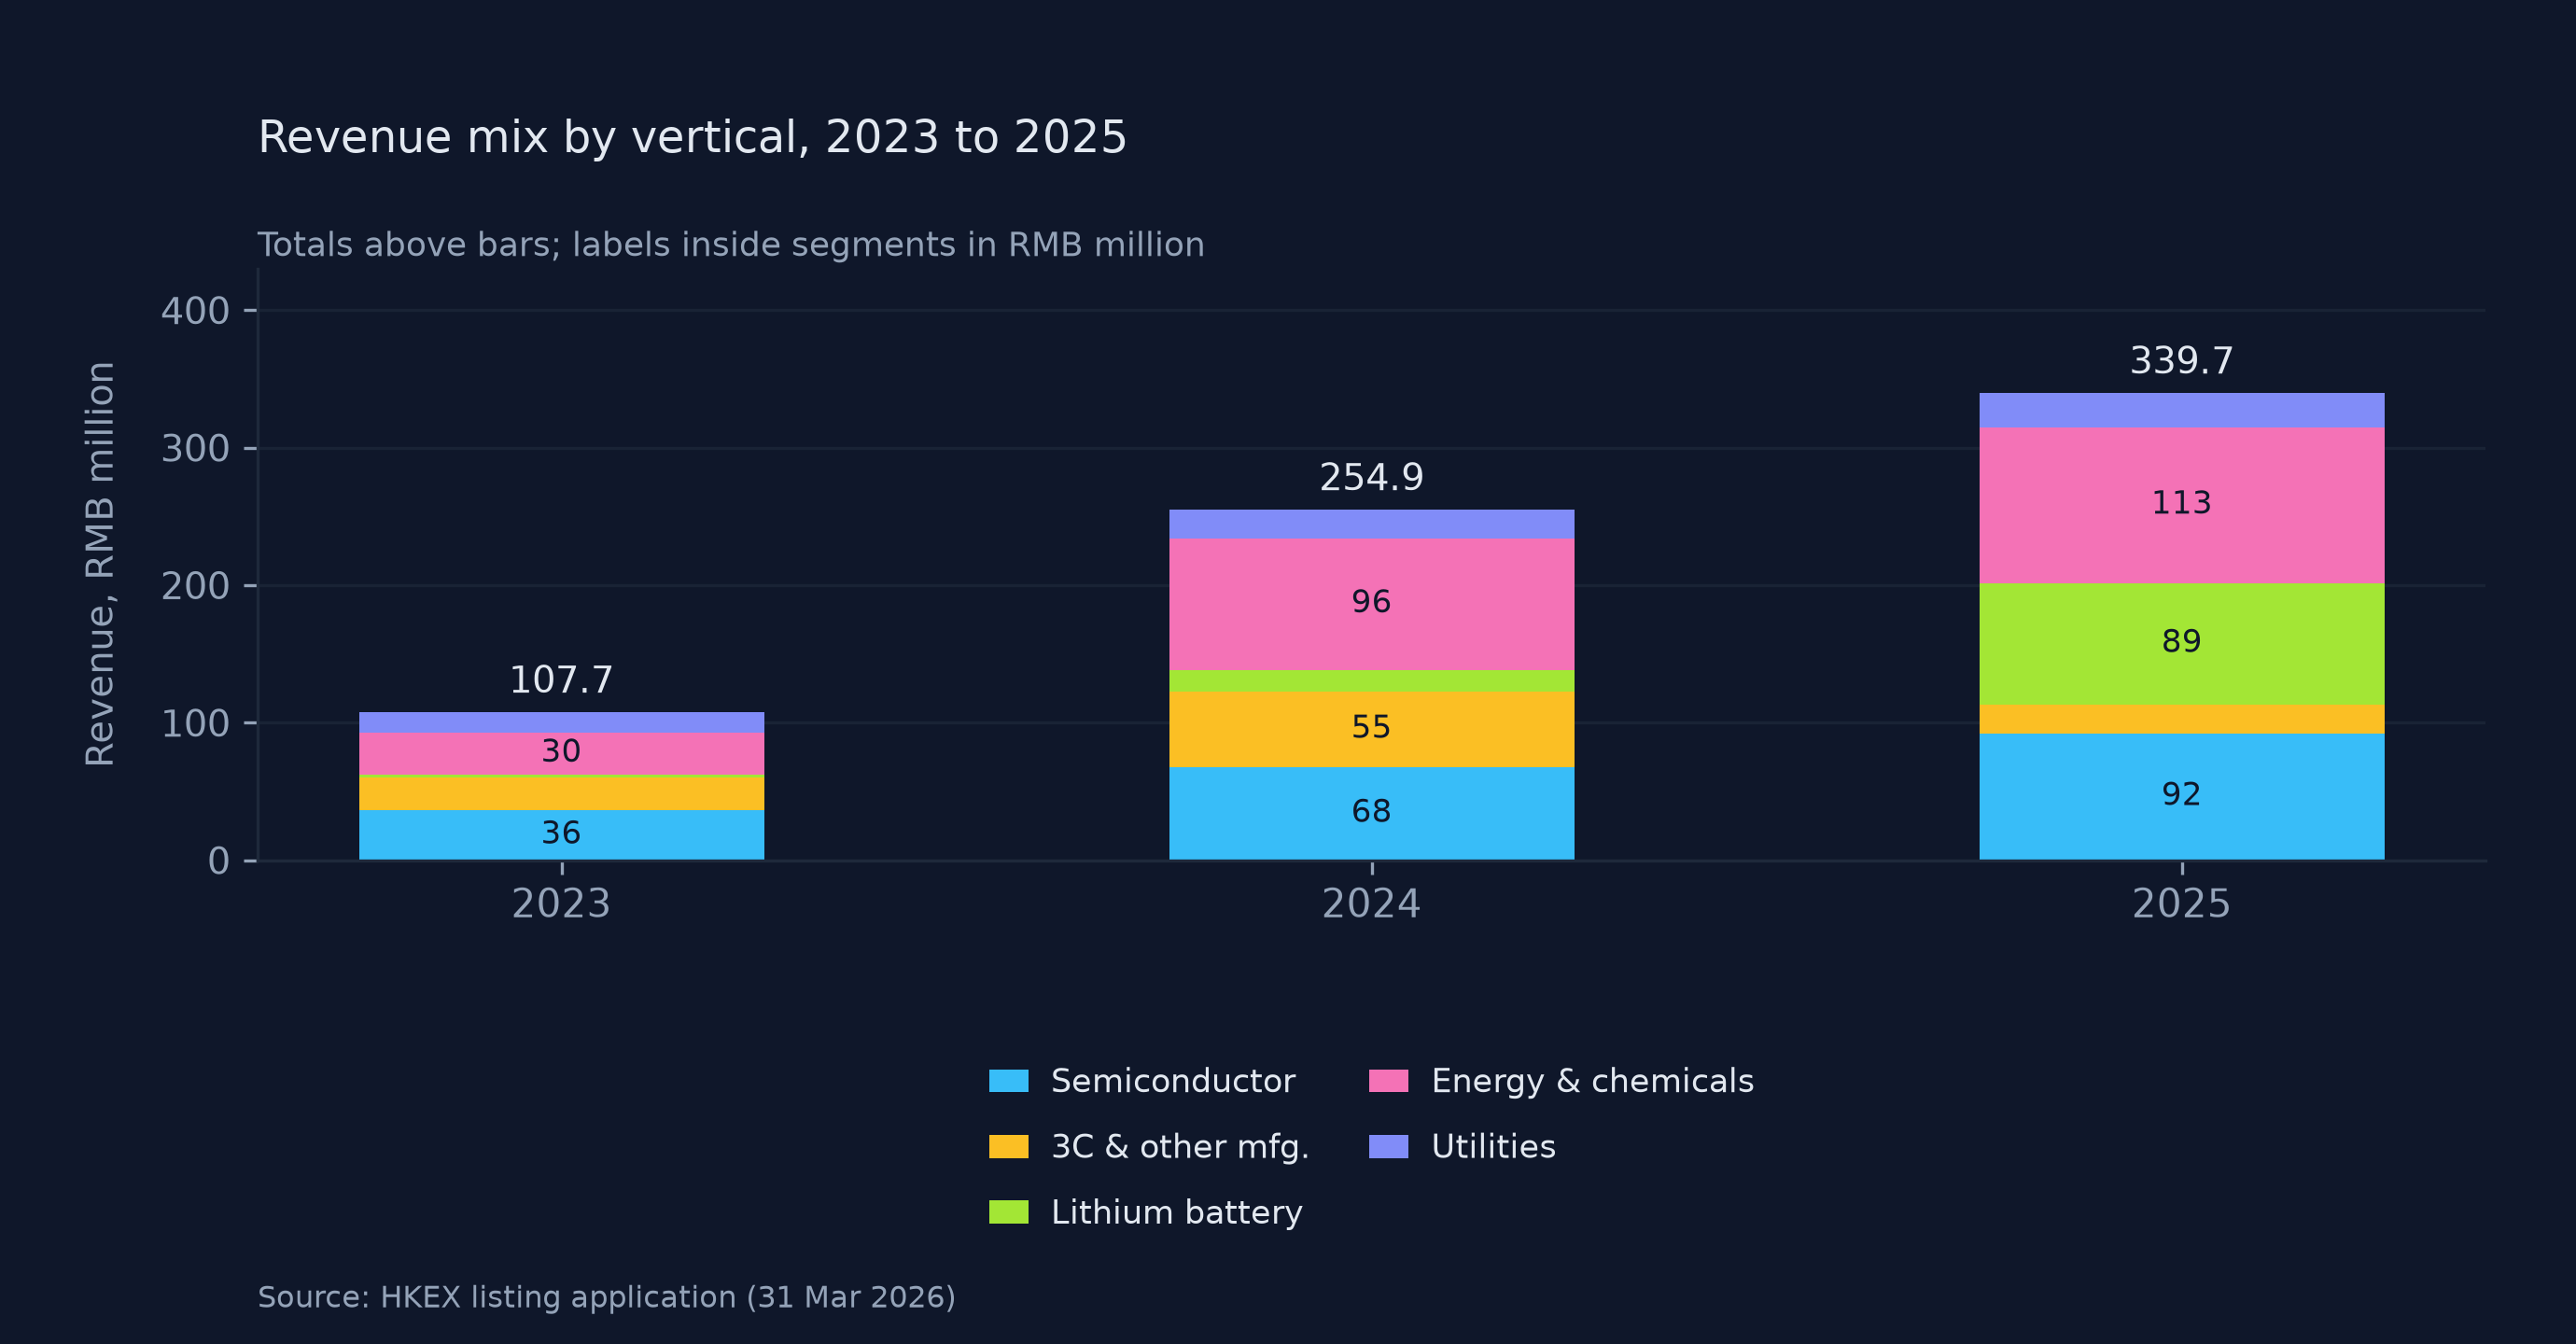
Fig 5 Revenue by vertical, 2023 to 2025; segments below 30% carry no label and their values appear in the text.
Source: HKEX listing application (31 Mar 2026).
The 3C reversal deserves its own paragraph. Revenue in that vertical fell from RMB 54.8 million in 2024 to RMB 20.7 million in 2025, down 62%, while orders went from 124 to 1161HKEXView the entry below →. Dividing 3C revenue by 3C orders puts the average project at RMB 442,000 in 2024 and RMB 179,000 in 2025, which matches the smaller-project reading. Order volume held while revenue fell 62%, and that combination is direct evidence of revenue growth and order growth parting ways in a project business.
8.2 Two measures of loss
Loss has to be shown on two measures at once (Figure 6). Under IFRS the reported loss for the year was RMB 260.0 million, RMB 200.2 million and RMB 384.3 million, up 92% in 2025. Stripping out three non-cash or non-operating items leaves an adjusted net loss of RMB 131.4 million, RMB 81.2 million and RMB 106.0 million, up 30% in 20251HKEXView the entry below →.
The difference comes mainly from the change in the carrying value of redeemable liabilities, RMB 249.4 million in 2025. That item is non-cash, arises from redemption rights issued to investors, and ends when the listing completes, at which point it moves to equity1HKEXView the entry below →. At the end of 2025 net liabilities stood at RMB 1.94 billion, mostly redeemable liabilities, a position that turns into net assets after listing1HKEXView the entry below →. One measure shows loss nearly doubling and the other shows operating loss up 30%, so taking either alone gives the opposite reading.
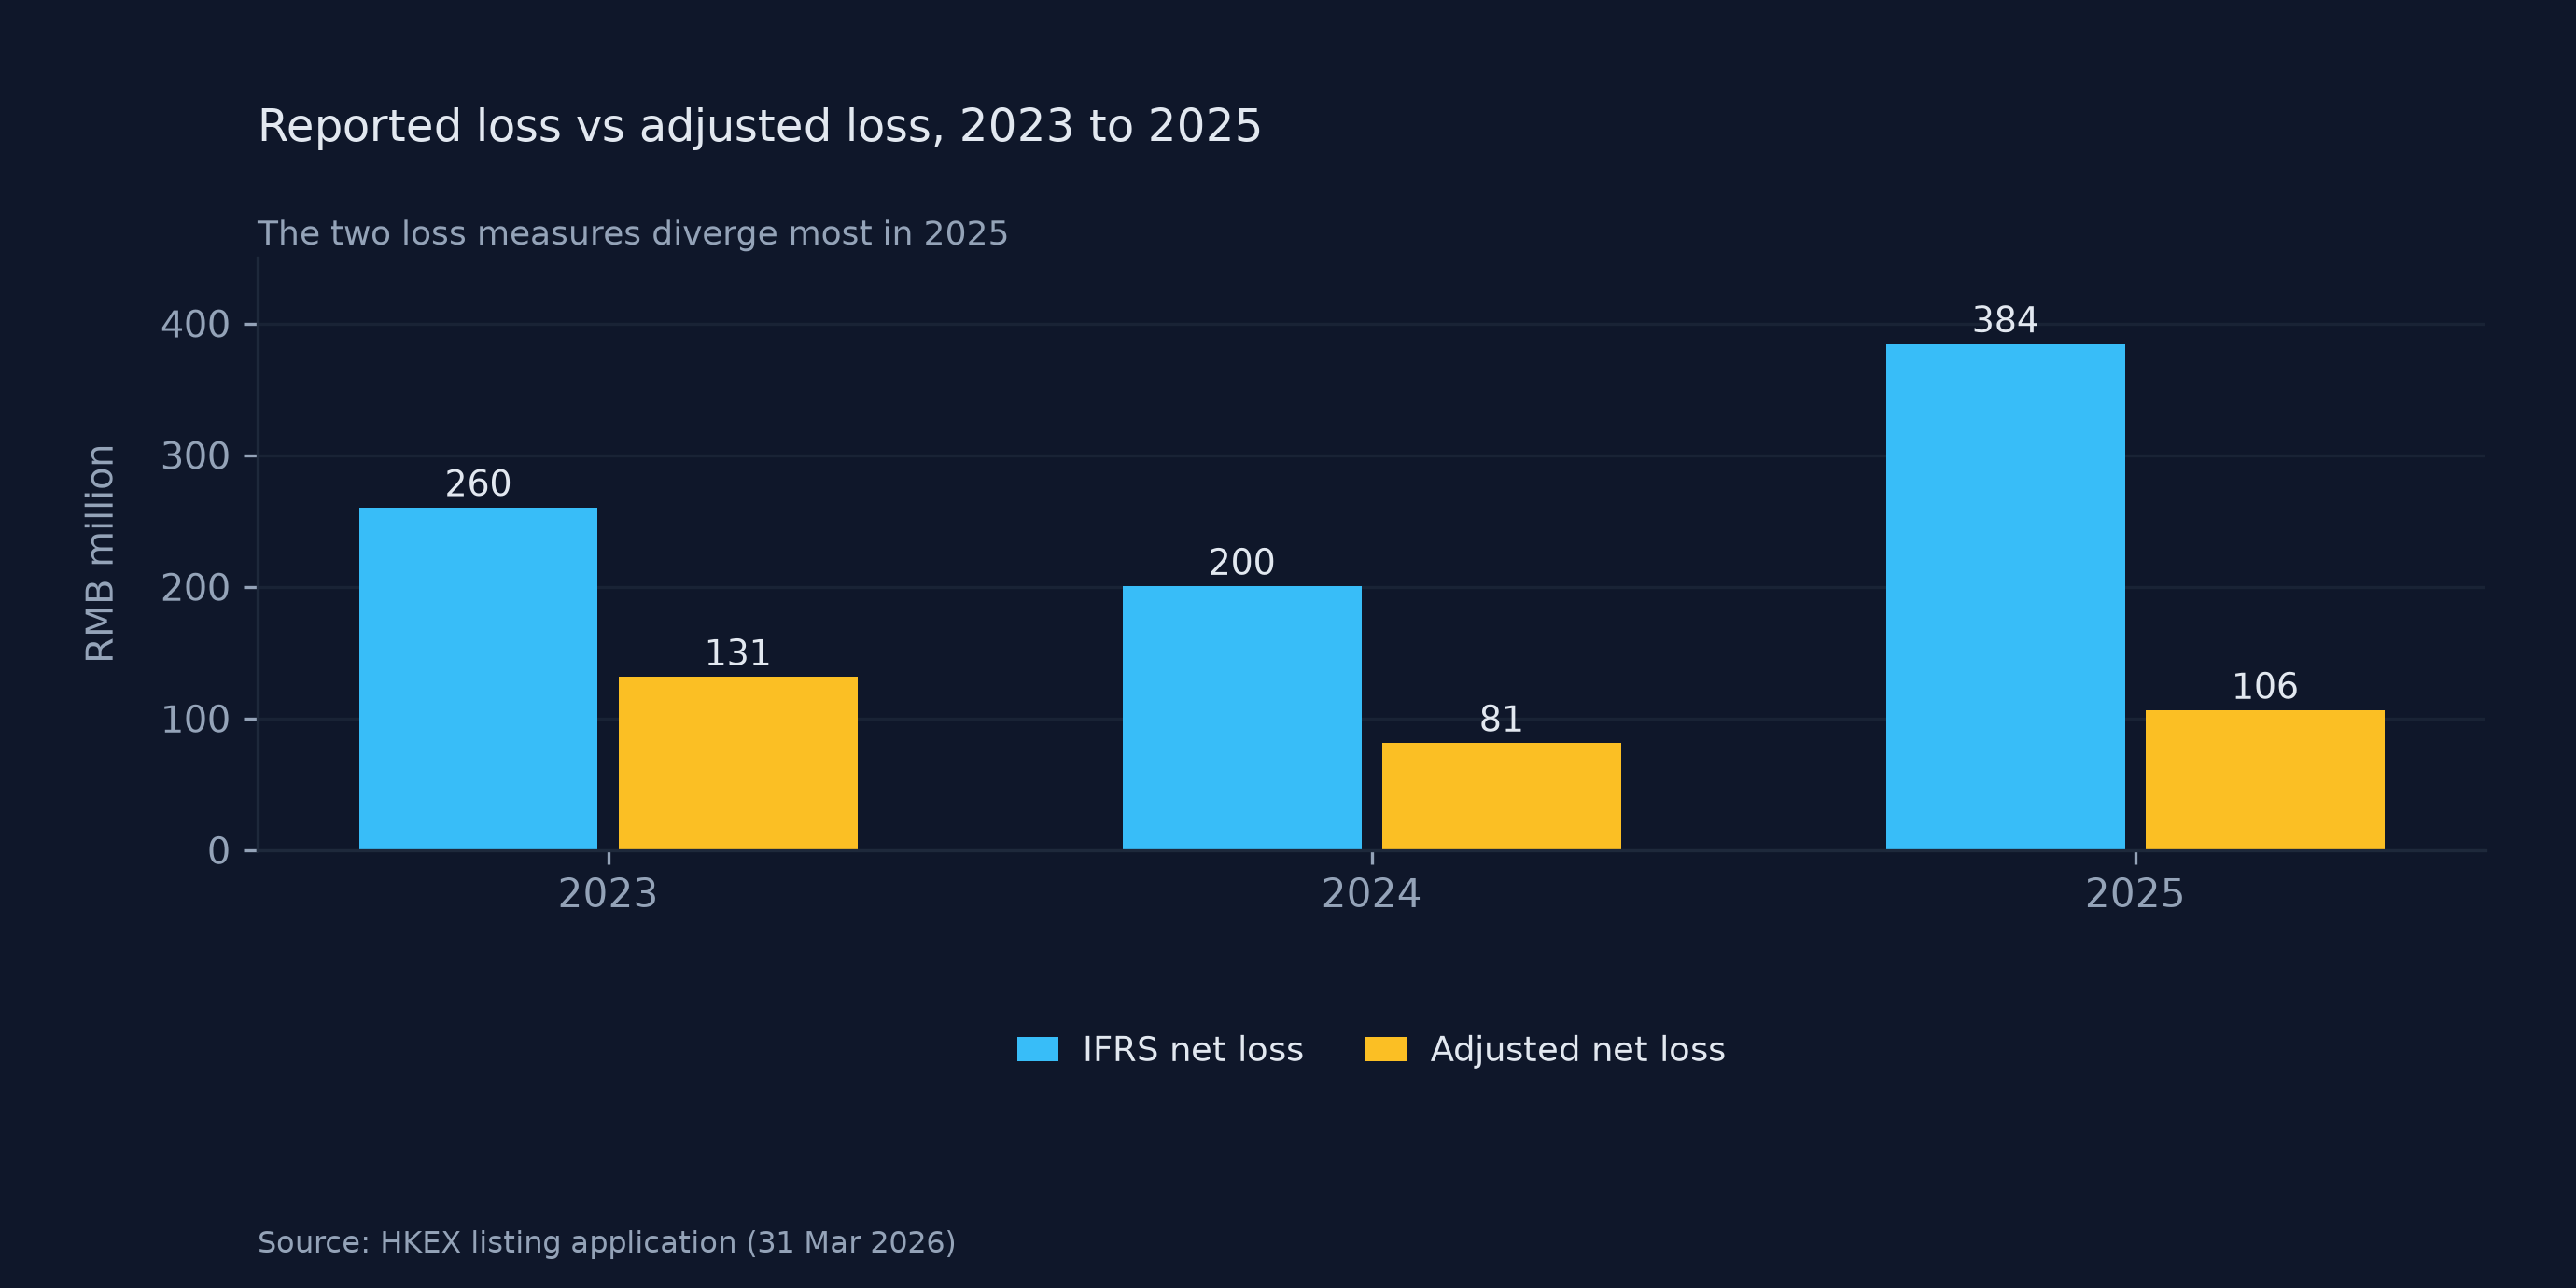
Fig 6 Reported loss and adjusted net loss, 2023 to 2025.
Source: HKEX listing application (31 Mar 2026).
8.3 Cash and consumption
Operating cash outflow ran at RMB 94.4 million, RMB 79.5 million and RMB 185.0 million across the three years1HKEXView the entry below →. The 2025 burn rate, which the filing defines as monthly operating cash outflow plus capital spending and lease payments, reached RMB 16.4 million, more than double the RMB 7.8 million a month of a year earlier1HKEXView the entry below →. At the end of 2025 the company held RMB 243.4 million in cash and equivalents, or RMB 427.3 million including available bank facilities1HKEXView the entry below →.
Held static at the 2025 burn, that RMB 427.3 million covers a little over two years, since annual consumption runs near RMB 197 million. The arithmetic is not a view on the listing outcome. The filing states that if the application is withdrawn or rejected, the redemption rights that had terminated come back1HKEXView the entry below →, so the two paths produce materially different financial results. On valuation, the last pre-IPO round priced the company at RMB 2.08 billion, about six times 2025 revenue1HKEXView the entry below →4Sina FinanceView the entry below →. The multiple is calculated here from a figure quoted by media, and neither it nor the valuation replaces the issue price.
9. Substitutability: where switching costs sit
Switching costs are high where projects run deep and on site. A single project takes more than 250 days from signature to acceptance, covering design, configuration, software development, deployment and training, and the software is bound to the project, so replacing a supplier means redoing the integration1HKEXView the entry below →. Semiconductor fabs carry a further cost in process knowledge, and the 75% repeat rate there in 20251HKEXView the entry below → shows installed lines keep adding units.
Switching costs are low on the body. Robotic arms, lidar, drive modules and structural modules are all bought in and all replaceable. The company lists multi-sourcing as supply chain policy, which means the hardware does not lock a customer in and a competitor can assemble something similar from the same class of parts1HKEXView the entry below →. Humanoids are sourced the same way, so hardware differences can be erased quickly.
Patents and data offer limited protection. Of more than 240 Chinese patents, 43 are invention patents, under a fifth of the total, and 140 are utility models, with the remainder unclassified in the summary, so protection rests mostly on structure rather than on claims of broad scope. On data, the company discloses no in-house dataset and no annotation volume. Differentiation shows up in delivery depth and industry fit, while defensibility cannot be confirmed from public information, so a further judgement has no basis.
10. Variables: three observable signals
The first is the largest customer's share, at 20.4% of revenue1HKEXView the entry below →5Securities DailyView the entry below →. A further rise would mean growth depends more on one project. A fall alongside continued growth would mean lithium demand belongs to the industry rather than to one account.
The second is evidence that intent converts, and three actions would show it: a separate humanoid revenue line in the next filing, the first named industrial site for a humanoid, and a shorter delivery cycle as standardisation advances1HKEXView the entry below →6Shanghai Securities NewsView the entry below →. All three appearing together would put humanoids into production; one alone would leave them at the demonstration stage.
The third is the speed and shape of overseas revenue. Reported as everything outside the Chinese mainland, it rose from RMB 5.9 million to RMB 21.4 million and grew 44.6% in 20251HKEXView the entry below →, faster than the domestic business. A country split in the next filing would make the Japan, Thailand and Germany contributions checkable. If growth falls below the overall rate, overseas has not yet become a separate growth engine. The trajectory of the overseas share is the testable part of the globalisation story.
Two secondary signals follow. Top five supplier concentration has fallen two years running to 19.4%1HKEXView the entry below →, and further decline would produce more dispersed sourcing with weaker bargaining. Gross margin in industrial logistics sits nearly twenty points below inspection1HKEXView the entry below →, so if it does not rise, a mix tilting toward logistics will pull the overall margin down.
Sources and data notes
Exchange rate approximations: RMB 7.2 per USD, used for rough conversions only, as of 19 Oct 2026.
Lingshu is rendered as a transliteration because no official English name was found for this model. Edge and FabriX follow the company's own English usage.
Some sources require a subscription or block automated access. All thirteen were checked individually on 19 Oct 2026 and returned HTTP 200.